- GBP/USD Price Analysis: Dives to mid-1.1100s, seems vulnerable near two-week low
Market news
GBP/USD Price Analysis: Dives to mid-1.1100s, seems vulnerable near two-week low
- GBPUSD extends the downtrend for the second successive day and dives to a two-week low.
- The sharp intraday fall confirms a bearish breakdown through the 1.1370 confluence support.
- The oversold RSI (14) on hourly charts warrants some caution before placing fresh bearish bets.
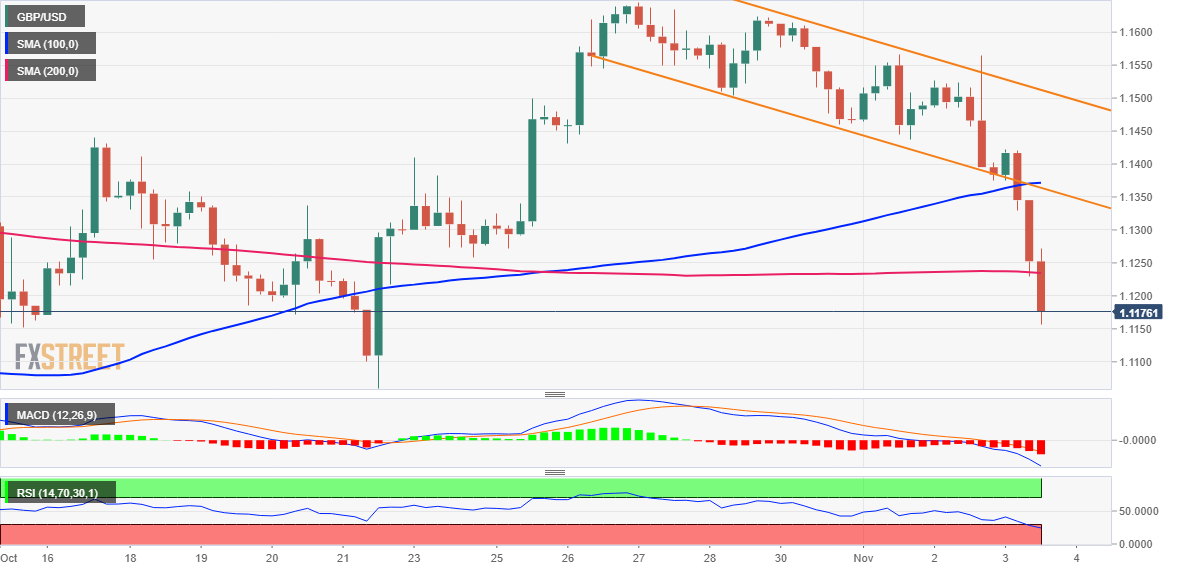
The GBPUSD pair extends the previous day's post-FOMC sharp downfall from the 1.1565 region and remains under heavy selling pressure for the second straight day on Thursday. The downward trajectory picks up pace after the Bank of England announced its policy decision and drags spot prices to a fresh two-week low, closer to mid-1.1100s during the early North American session.
A convincing breakthrough the 1.1370 confluence support, comprising the lower end of a one-week-old descending channel and the 100-period SMA on the 4-hour chart, was seen as a key trigger for bearish traders. Some follow-through selling below the 200-period SMA and the 1.1200 round figure aggravates the bearish pressure and might have set the stage for a further depreciating move.
The negative outlook is reinforced by the fact that oscillators on the daily chart have just started drifting into bearish territory. That said, RSI (14) on hourly charts is already flashing oversold conditions, making it prudent to wait for some consolidation or a modest bounce before the next leg down. Nevertheless, the GBPUSD pair seems poised to extend its recent slide from a multi-week high.
The next relevant target to the downside is pegged near the 1.1100 round-figure mark before spot prices eventually drop to the 1.1060 region. The downward trajectory could further get extended to the 1.1000 psychological mark en route to the September monthly low, around the 1.0925 area.
On the flip side, any meaningful recovery attempted might attract fresh sellers near the 1.1200 mark. This, in turn, should cap the GBPUSD pair near the 200-period SMA on the 4-hour chart, currently around the 1.1235-1.1240 region. A sustained strength beyond, though seems unlikely, might trigger a short-covering rally and allow bulls to aim back to reclaim the 1.1300 round figure.
GBP/USD 4-hour chart
Key levels to watch