- Silver Price Analysis: XAGUSD flirts with 100-day EMA hurdle, remains below $20.00 mark
Market news
Silver Price Analysis: XAGUSD flirts with 100-day EMA hurdle, remains below $20.00 mark
- Silver gains strong traction for the second straight day and climbs beyond the mid-$19.00s.
- The neutral technical setup warrants some caution before positioning for any further gains.
- A sustained strength beyond the $20.00 mark is needed to confirm a fresh bullish breakout.
Silver builds on the previous day's solid recovery from the $18.85-$18.80 support zone and gains some follow-through traction for the second straight day on Friday. The white metal maintains its bid tone through the early European session and is currently trading around the $19.70-$19.80 region, up over 1.30% for the day.
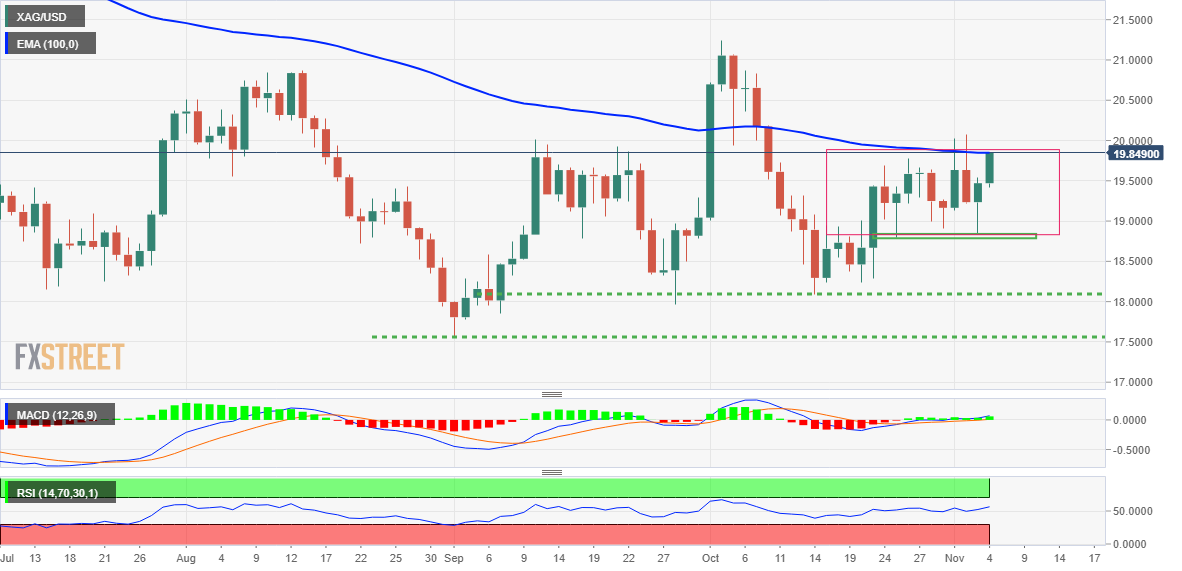
Looking at the broader technical picture, the recent two-way price moves witnessed over the past two weeks or so constitute the formation of a rectangle on the daily. This points to indecision over the near-term trajectory for the XAGUSD. Furthermore, the metal's inability to find acceptance above the 100-day EMA and this week's failures near the $20.00 psychological mark warrants caution for bullish traders.
This makes it prudent to wait for a sustained break through the handle before positioning for any further near-term appreciating move. With oscillators on the daily chart moving in the positive territory, the XAGUSD might then accelerate the momentum towards an intermediate resistance near the $20.50 region. The momentum could get extended and allow the bulls to eventually aim back to reclaim the $21.00 mark.
On the flip side, the daily swing low, around the $19.40 region, now seems to protect the immediate downside ahead of the $19.00 round figure. Any subsequent slide might continue to find decent support near the $18.85-$18.80 horizontal zone, which if broken decisively will shift the bias in favour of bearish traders. The subsequent downfall has the potential to drag the XAGUSD to the $18.30-$18.25 support zone.
This is closely followed by the $18.00 round-figure mark, below which spot prices could slide further towards challenging the YTD low, around the $17.55 zone touched in September.
Silver daily chart
Key levels to watch