- USDJPY Price Analysis: Tumbles from 147.00 after testing a two-week-old resistance
Market news
USDJPY Price Analysis: Tumbles from 147.00 after testing a two-week-old resistance
- The USDJPY is testing the drops for the second straight day and tests last Friday’s low.
- Elevated US Treasury yields, alongside a two-month-old upslope trendline, capped the USDJPY from falling below 145.00.
- USDJPY Price Analysis: A daily close below 146.50 exacerbates a fall to the 100-day EMA; otherwise, the pair could test 148.00.
The USDJPY consolidates above a two-month-old upslope trendline drawn from September 16 lows around 140.27, previously tested twice. Still, Japanese Yen buyers could not crack it following the two “known” Bank of Japan (BoJ) interventions, opening the door for further American Dollar upside. Also, the US Treasury yields rise, putting a lid on the USDJPY fall, and with further Federal Reserve’s tightening looming, the USDJPY might re-test the YTD highs. At the time of typing, the USDJPY is trading at 146.59, below its opening price.
USDJPY Price Analysis: Technical outlook
Given the previously mentioned scenario of the USDJPY consolidating, as shown by the daily chart, the upside scenario might be capped by a downslope trendline drawn after the USDJPY hits its 151.94 YTD high, keeping the USDJPY from testing the 150.00 figure. The Relative Strength Index (RSI), at 49.44, is in bearish territory and opens the door for a test of the 50-day Exponential Moving Average (EMA) at 145.10 before the September 16 swing low at 140.27.
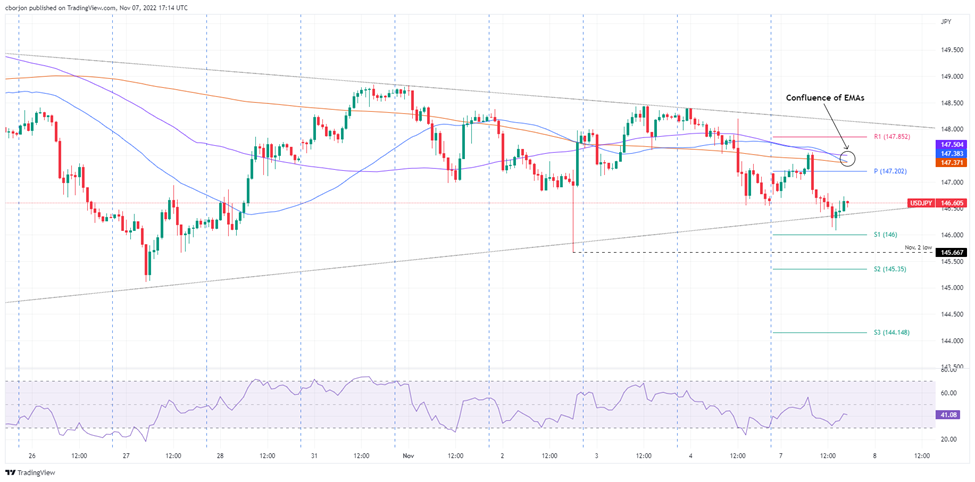
The USDJPY one-hour chart shows the pair dived to its daily low at 146.08, shy of the S1 daily pivot, and is testing last Friday’s low at 146.55. So if the USDJPY achieves a daily close below the latter, that could lay the ground for further downside pressure. If that scenario plays out, the USDJPY’s first support would be the S1 daily pivot of 146.00. Once cleared, the pair might test key support levels, like the November 2 daily low at 145.66, followed by the S2 daily pivot at 145.35 and the 145.00 figure.
On the flip side, if the USDJPY surpasses 147.00, it could exacerbate a rally toward 148.00. Hence, the USDJPY first resistance would be the daily pivot level at 147.20, followed by the confluence of the 50, 100, and 200-hour EMAs around 147.38/50, followed by the R1 daily pivot and the 148.00 figure.
USDJPY Key Technical Levels