- GBPJPY Price Analysis: Sellers in charge, as head-and-shoulders pattern emerged
Market news
GBPJPY Price Analysis: Sellers in charge, as head-and-shoulders pattern emerged
- GBPJPY trims some of its Thursday losses as the Asian session starts.
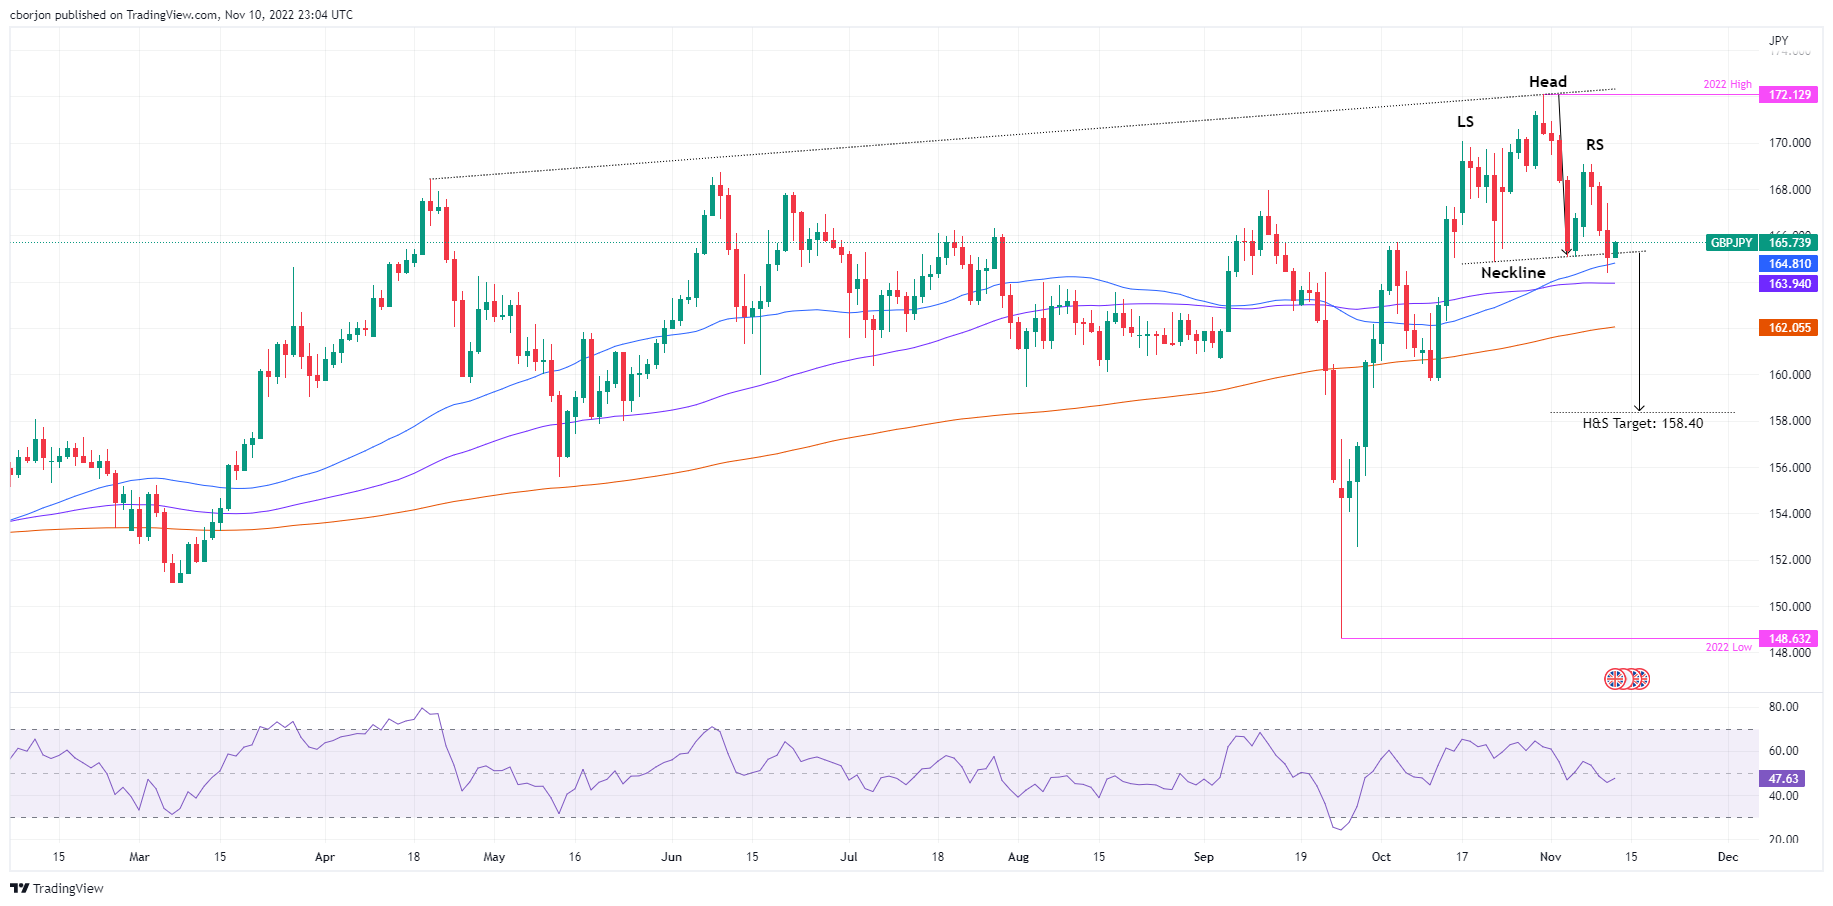
- A head-and-shoulders chart pattern in the GBPJPY daily chart targets a fall to 158.40.
- GBPJPY Price Analysis: A rise above 169.00 would invalidate the pattern; otherwise, the downtrend will resume.
The GBPJPY extended its losses for three consecutive days following the release of the US inflation report, which triggered a US Dollar (USD) sell-off. Therefore, the USDJPY sank more than 500 pips and weighed on the Pound Sterling, which weakened 0.71% vs. the Japanese Yen (JPY) on Thursday. As the Asian session begins, the GBPJPY trades at 165.76 and stages a comeback, pairing some of Thursday’s losses.
GBPJPY Price Analysis: Technical outlook
On Thursday, the GBPJPY pierced the 50-day Exponential Moving Average (EMA) but bounced off, achieving a daily close above 165.00. GBPJPY price action during the last 30 days formed a head-and-shoulders chart pattern, though, at the time of typing, the cross exchanges hands above the neckline. Nevertheless, to invalidate the pattern, the GBP needs to lift the cross above the right-shoulder swing high at 169.00. Otherwise, if the GBPJPY resumes its downward path below the neckline, which passes at around 165.30, it would validate the head-and-shoulders chart pattern.
Therefore, the GBPJPY’s first support would be the psychological 165.00 figure. Break below will expose the 50-day EMA at 164.80, followed by the November 10 swing low at 164.36, ahead of the 164.00 mark. Once cleared, the following demand area will be the 100-day EMA at 163.95, on its way, towards the head-and-shoulders target of 158.00.

GBPJPY Key Technical Levels