- WTI Price Analysis: Bears move in on the low hanging fruit, eye $78.00 after bullish correction
Market news
WTI Price Analysis: Bears move in on the low hanging fruit, eye $78.00 after bullish correction
- WTI bulls are moving in from the lows and eye the 38.2% ratio.
- Bears look for a discount to run deeper towards $78.00.
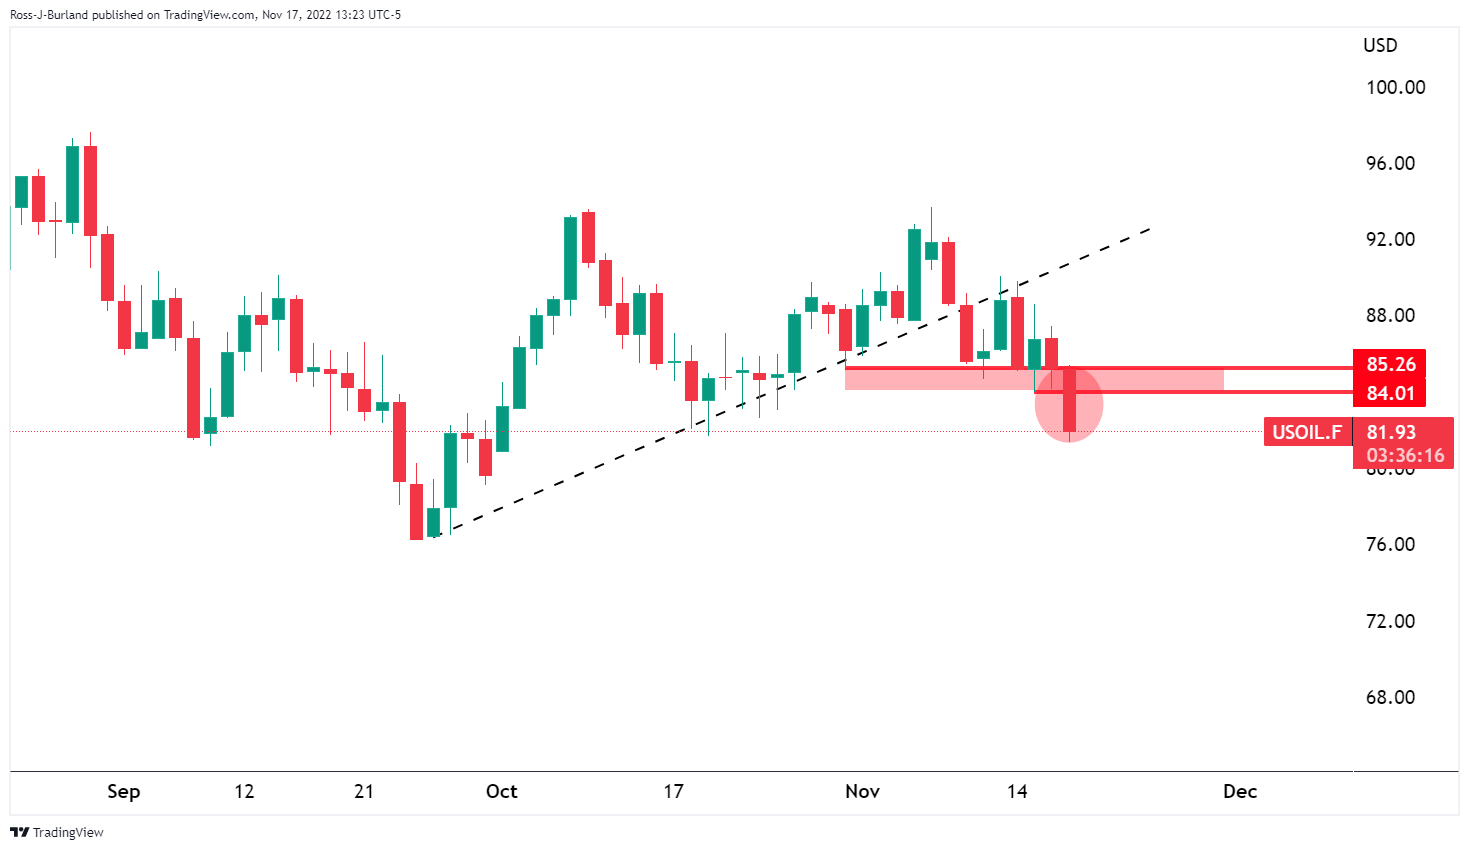
As per the prior analysis, WTI bears are pressuring the bulls below critical resistance, break of $84.00 on the cards, and the price of oil dropped on Thursday into low-hanging fruit below 84.00 following a build-up of longs.
WTI prior analysis
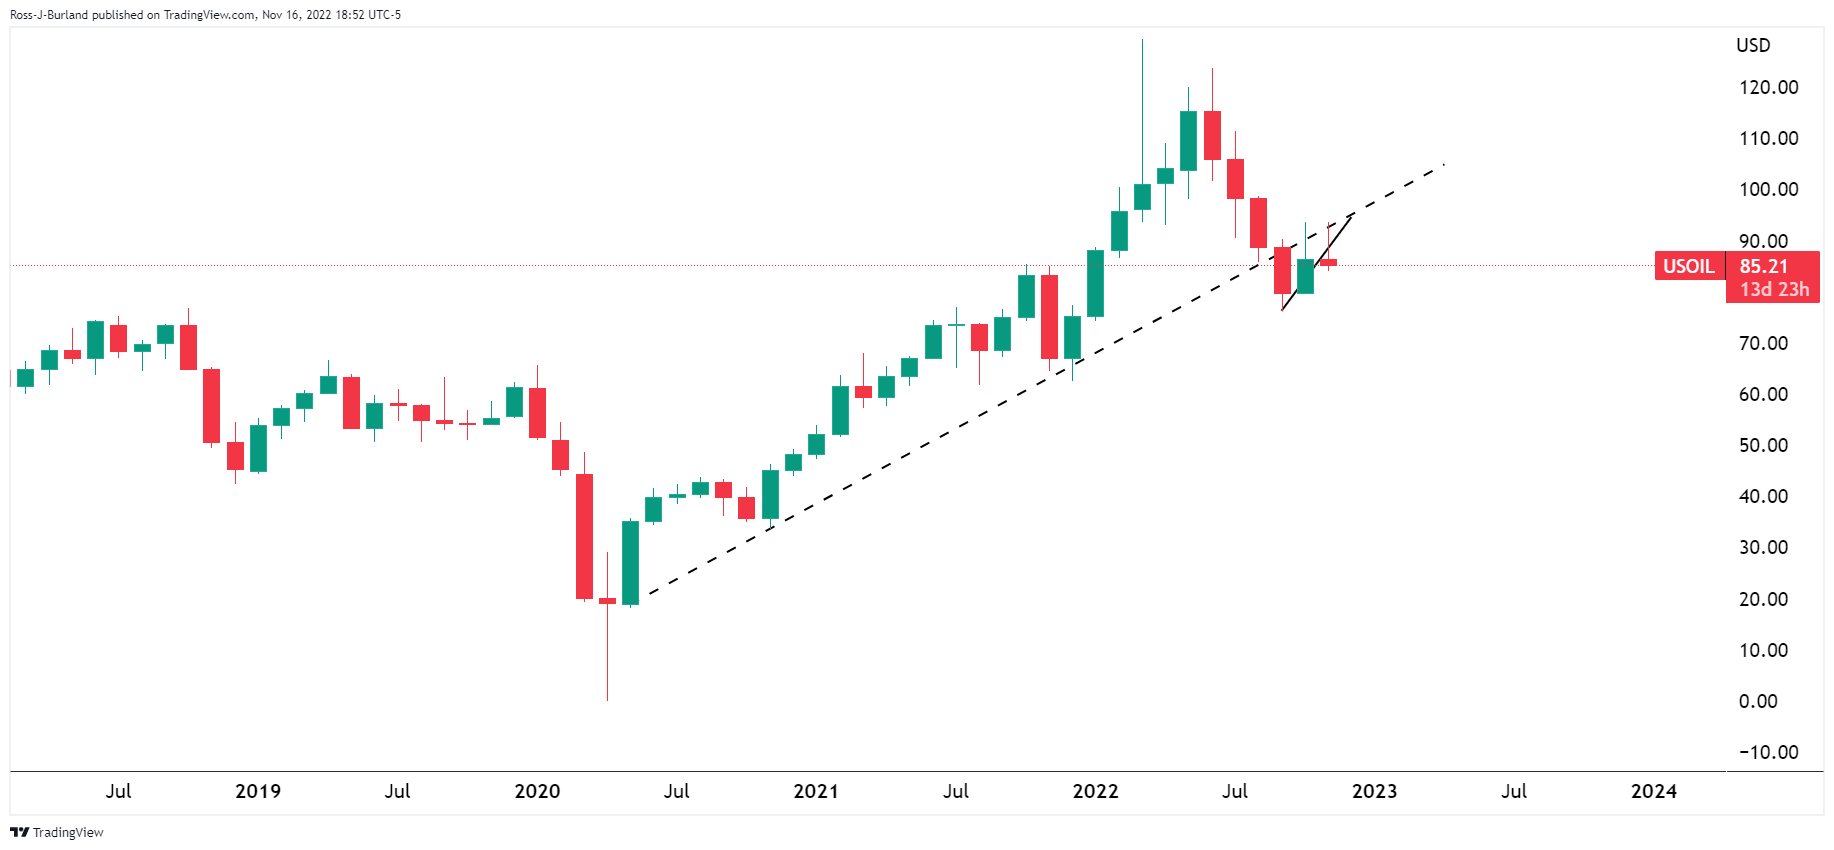
The price was shown to be on the back side of the monthly trendline and was being rejected on a restest:
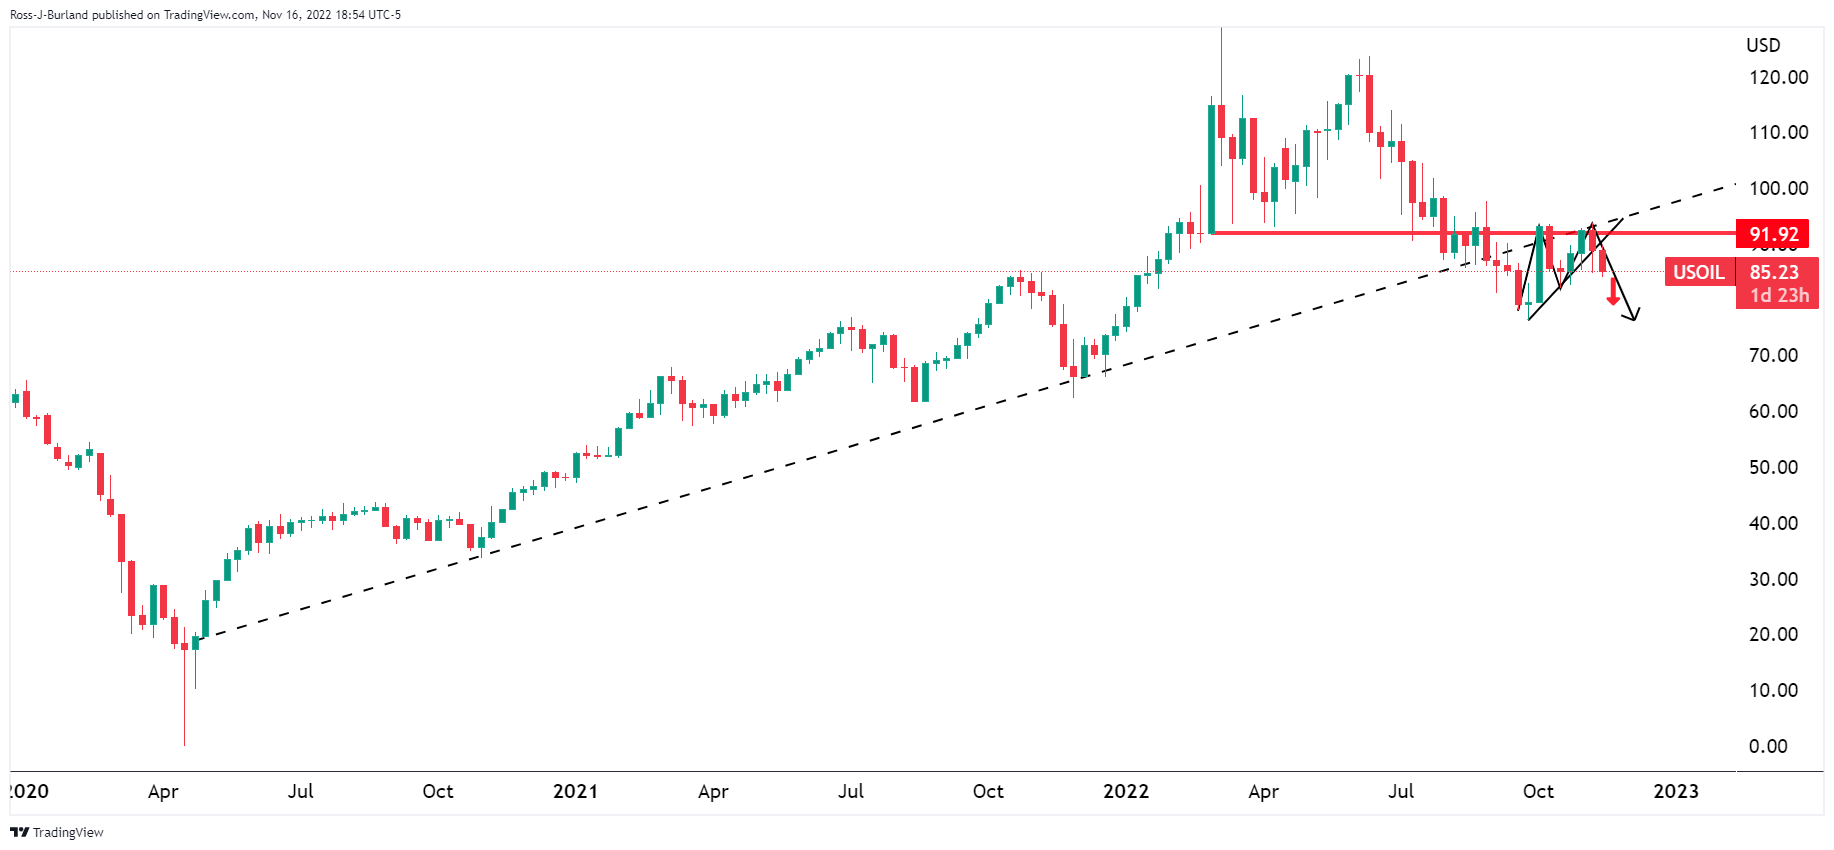
The price was looking to be on the verge of completing an M-formation below the locked-in highs below horizontal resistance:
A bearish H&S pattern had emerged on the daily chart with the right-hand shoulder on the backside of the micro trendline:
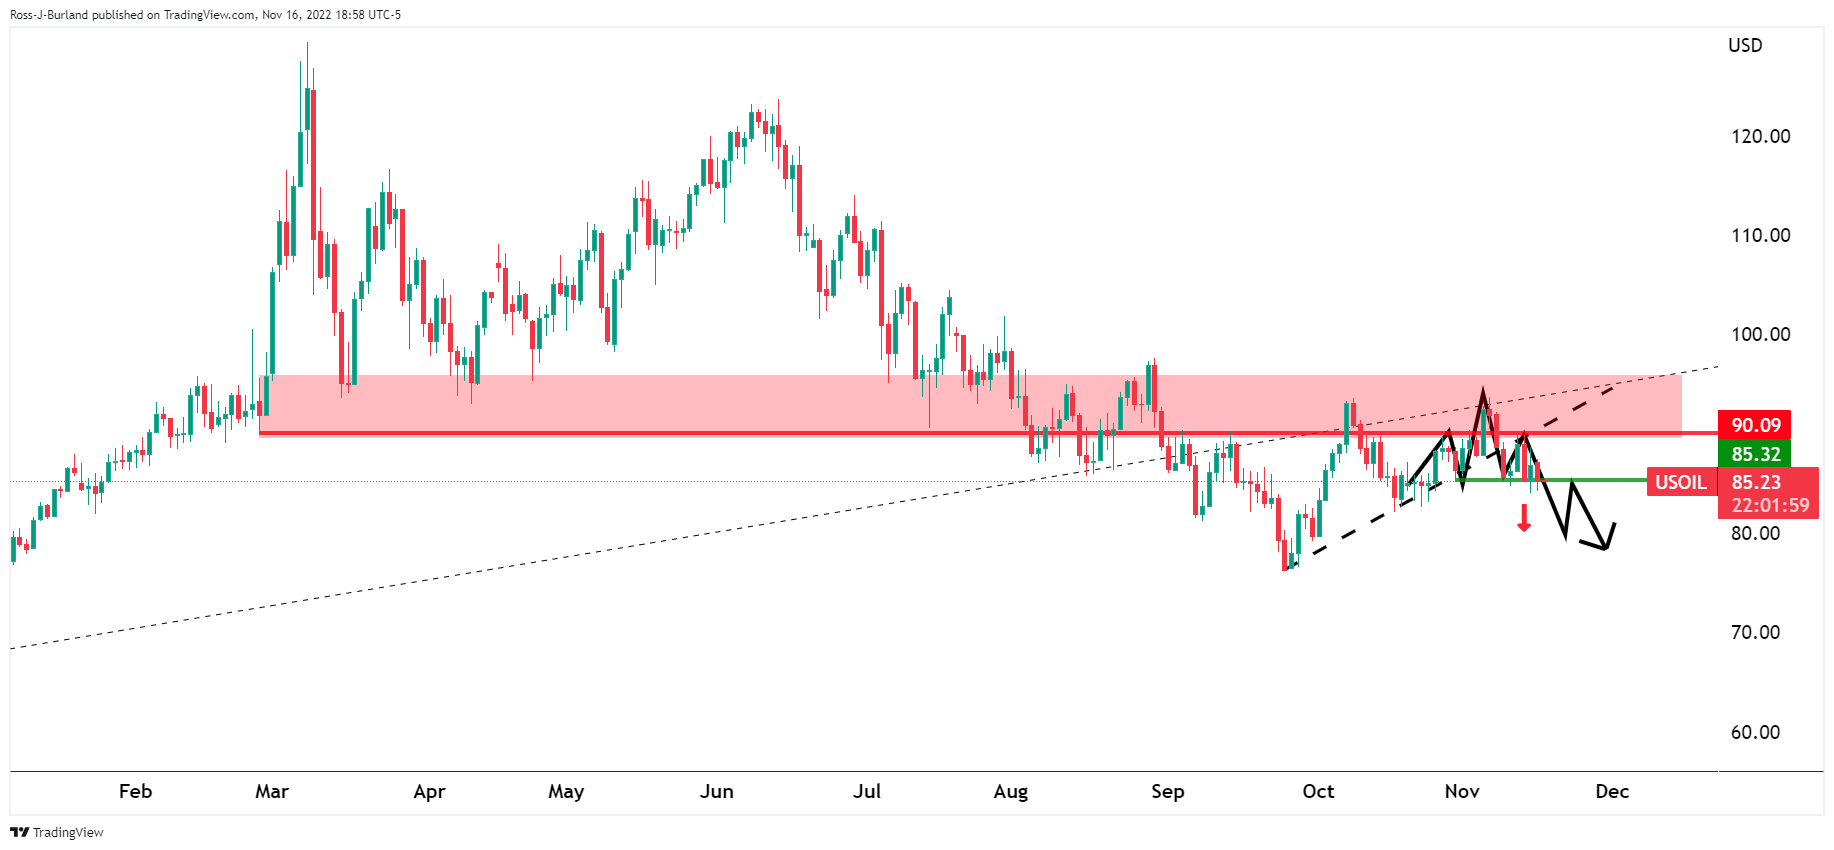
Zoomed in:
A move below $84 the figure was required to shift the bias fully:
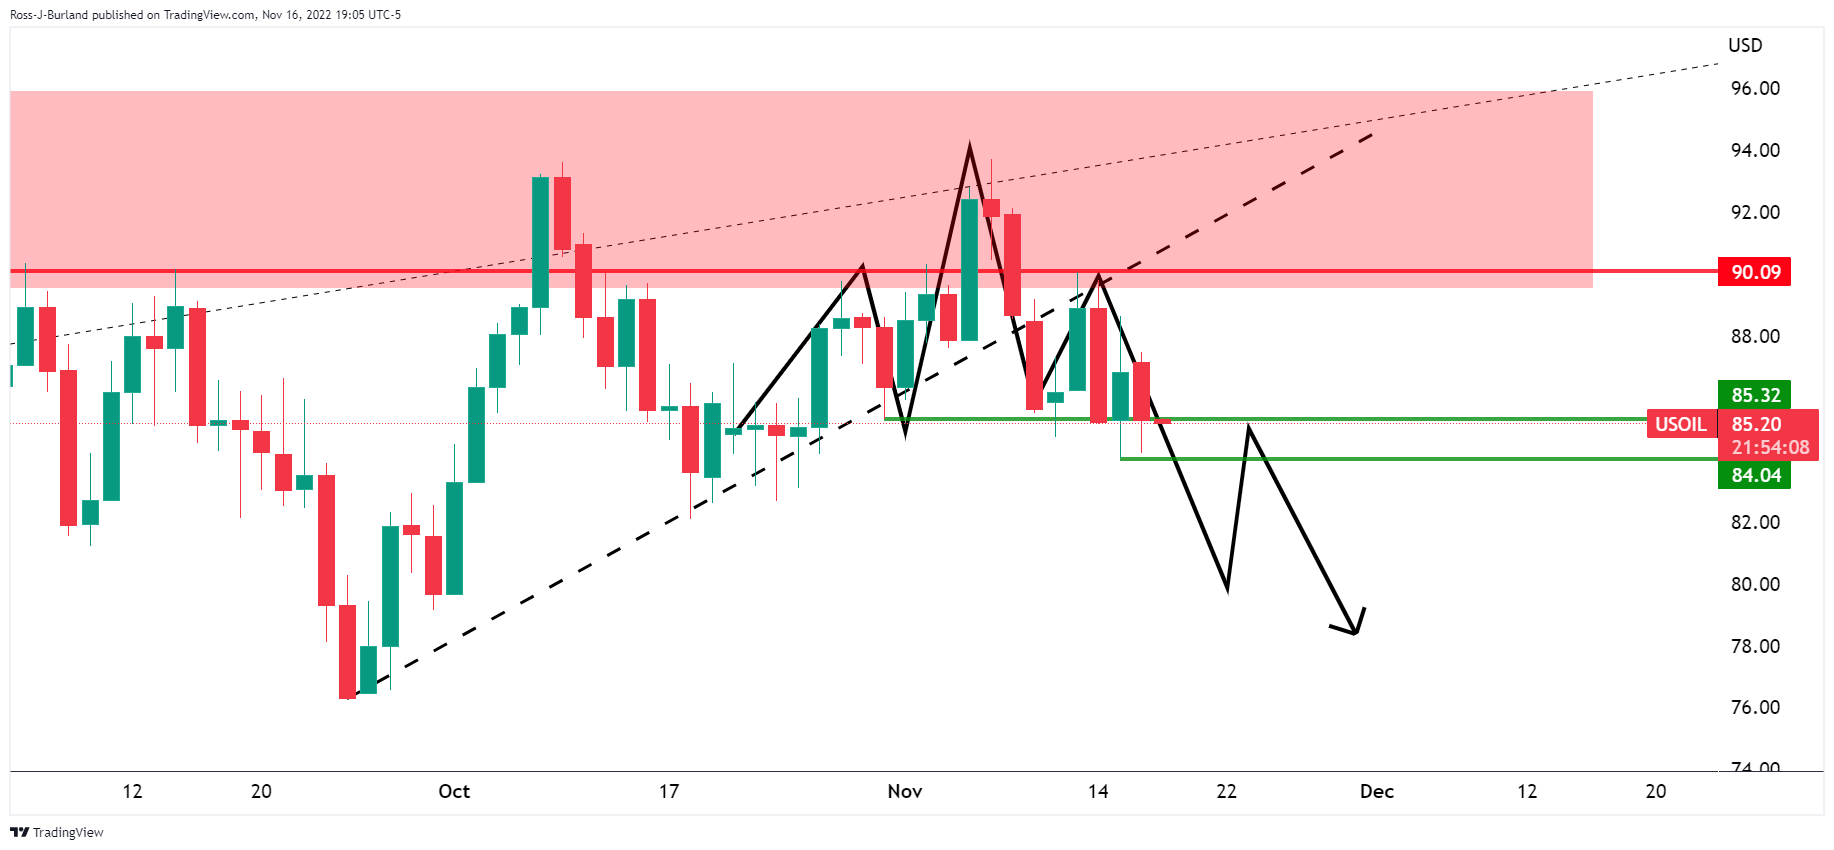
WTI update
As illustrated, the price has indeed followed the projected trajectory on Thursday. Bears can now target lower into the origin of the prior bullish trend:
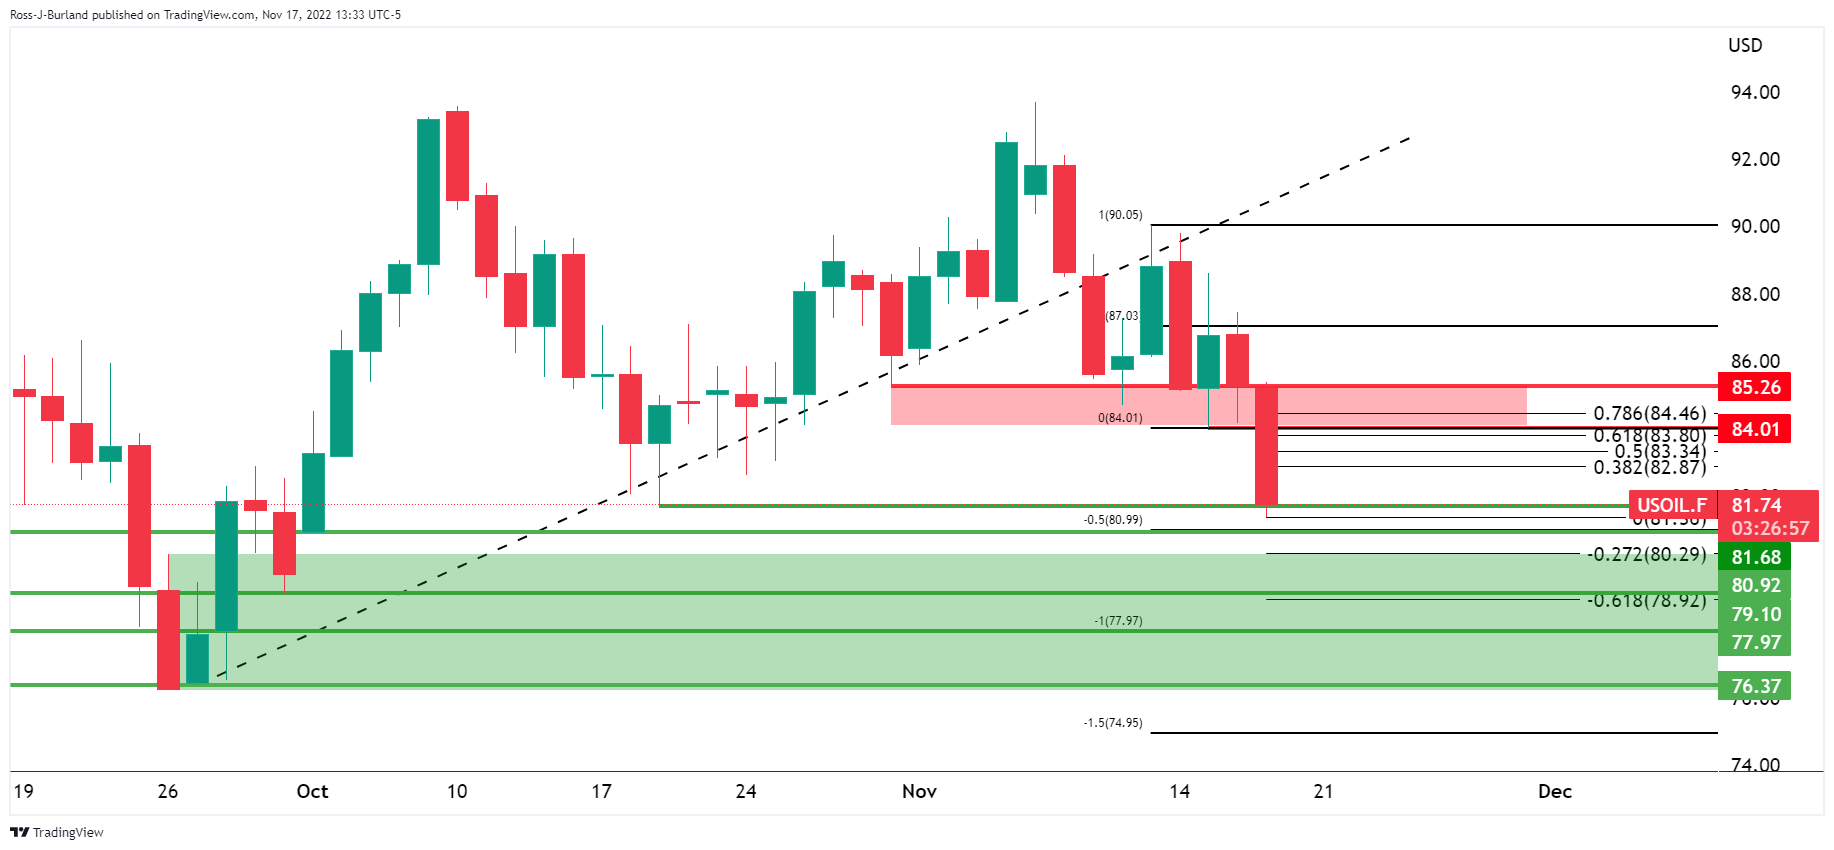
WTI H1 chart
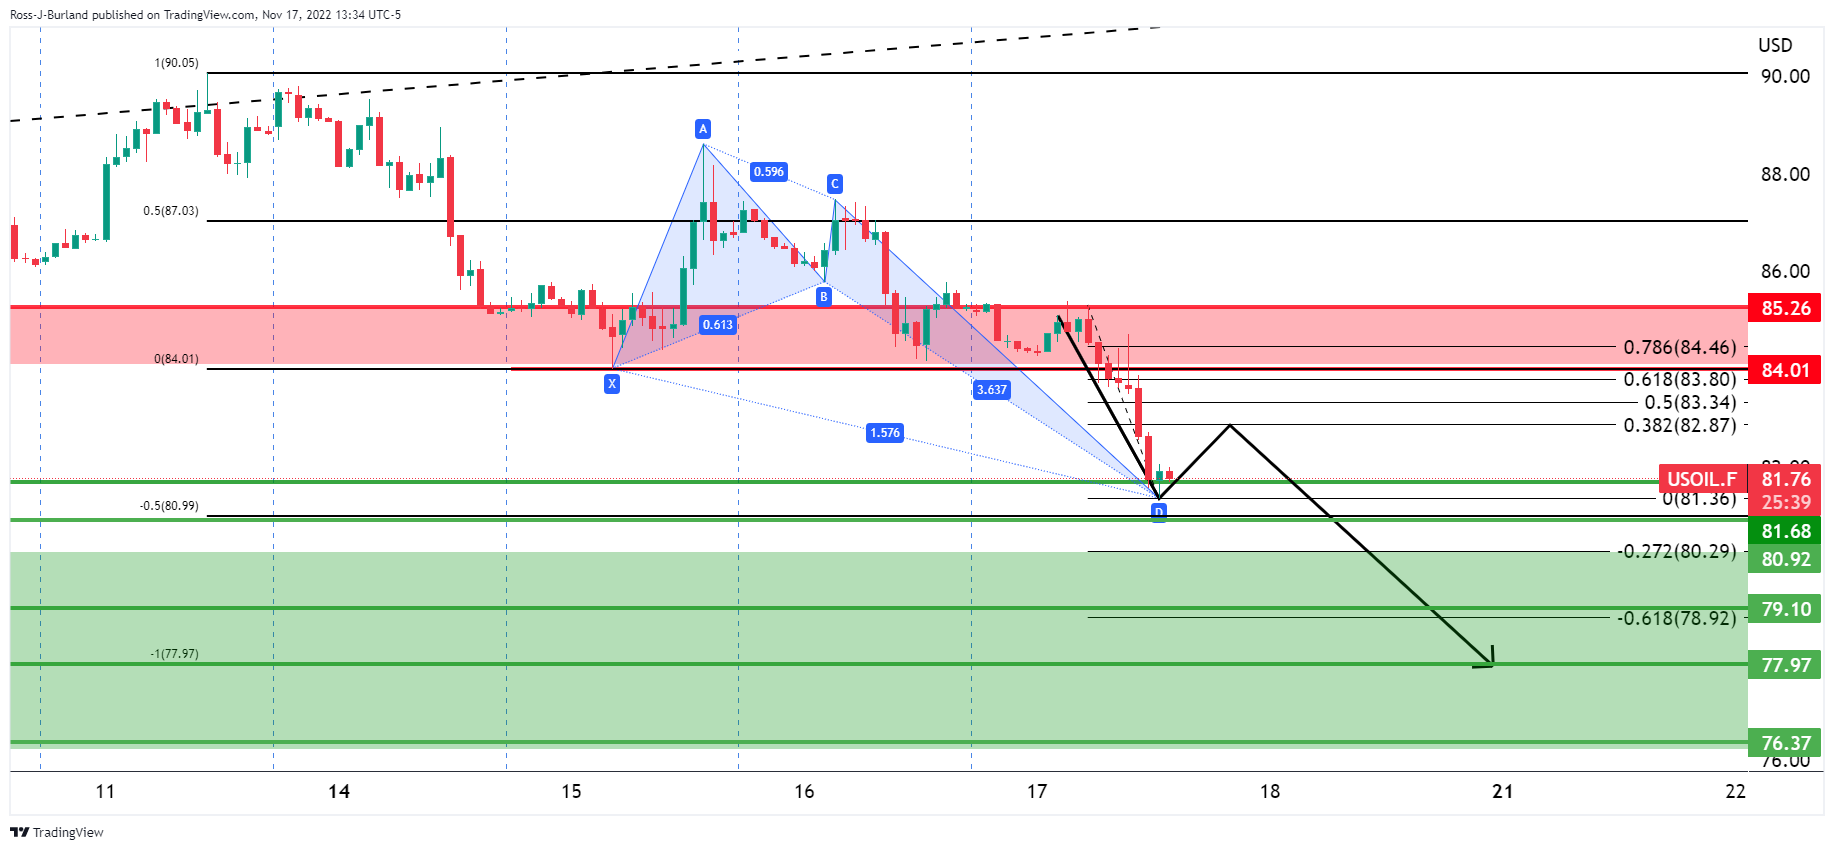
From an hourly perspective, drawing the expansion of the prior consolidative range, a full 100% measured move aims for a test of $78.00. However, a correction could be in order given the Grab harmonic pattern. A 38.2% Fibonacci retracement of the bearish impulse comes in near $82.90.