- NZDUSD Price Analysis: Steadies above 0.6100 inside bullish triangle
Market news
NZDUSD Price Analysis: Steadies above 0.6100 inside bullish triangle
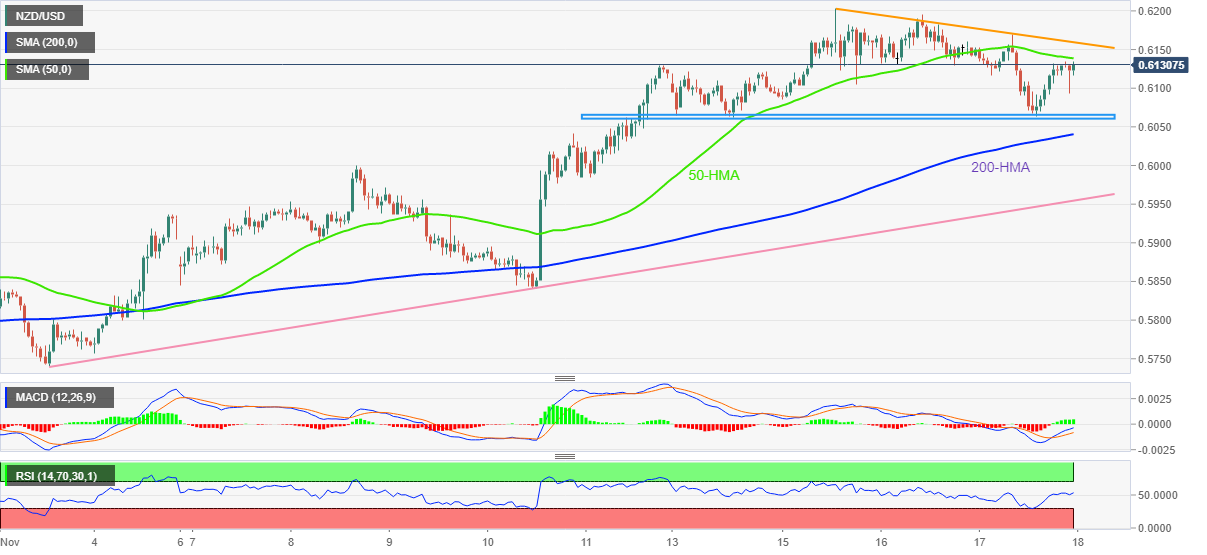
- NZDUSD remains sidelined after bouncing off a one-week-old horizontal support.
- Sluggish oscillators, bullish chart pattern keeps buyers hopeful but 0.6160 holds the key for the bull’s conviction.
- 200-HMA, fortnight-old ascending trend line restricts immediate downside.
NZDUSD seesaws around 0.6130, challenging a two-day downtrend, as traders struggle for fresh clues inside a one-week-old descending triangle bullish formation during early Friday.
In doing so, the Kiwi pair makes rounds to the 50-HMA amid the inactive performance of the Relative Strength Index (RSI) placed at 14, as well as the Moving Average Convergence and Divergence (MACD).
With this, the Kiwi pair is likely to remain sidelined during the five-week uptrend, despite the latest pullback.
However, a downside break of the stated triangle’s support area, near 0.6060, won’t hesitate to recall the NZDUSD bears.
Following that, the 200-HMA and a two-week-long ascending support line, respectively around 0.6040 and 0.5955, could challenge the quote’s further downside.
Meanwhile, the 50-HMA level surrounding 0.6140 restricts the immediate upside of the NZDUSD pair.
Even so, the stated triangle’s top line near 0.6160 appears crucial to convince the pair buyers in retaking control. Also acting as an upside filter is the monthly high near 0.6205.
Overall, NZDUSD buyers are likely to keep the reins despite the latest pullback in prices.
NZDUSD: Hourly chart

Trend: Limited recovery expected