- GBP/JPY Price Analysis: Struggles around 169.00, plunged 90 pips to 168.20s
Market news
GBP/JPY Price Analysis: Struggles around 169.00, plunged 90 pips to 168.20s
- GBP/JPY tumbled after testing 169.00, the head-and-shoulders right shoulder, so the pattern is still in play.
- Short term, the GBP/JPY might consolidate around 168.00-169.00.
- GBP/JPY Price Analysis: Break below 168.00 could pave the way toward 167.00.
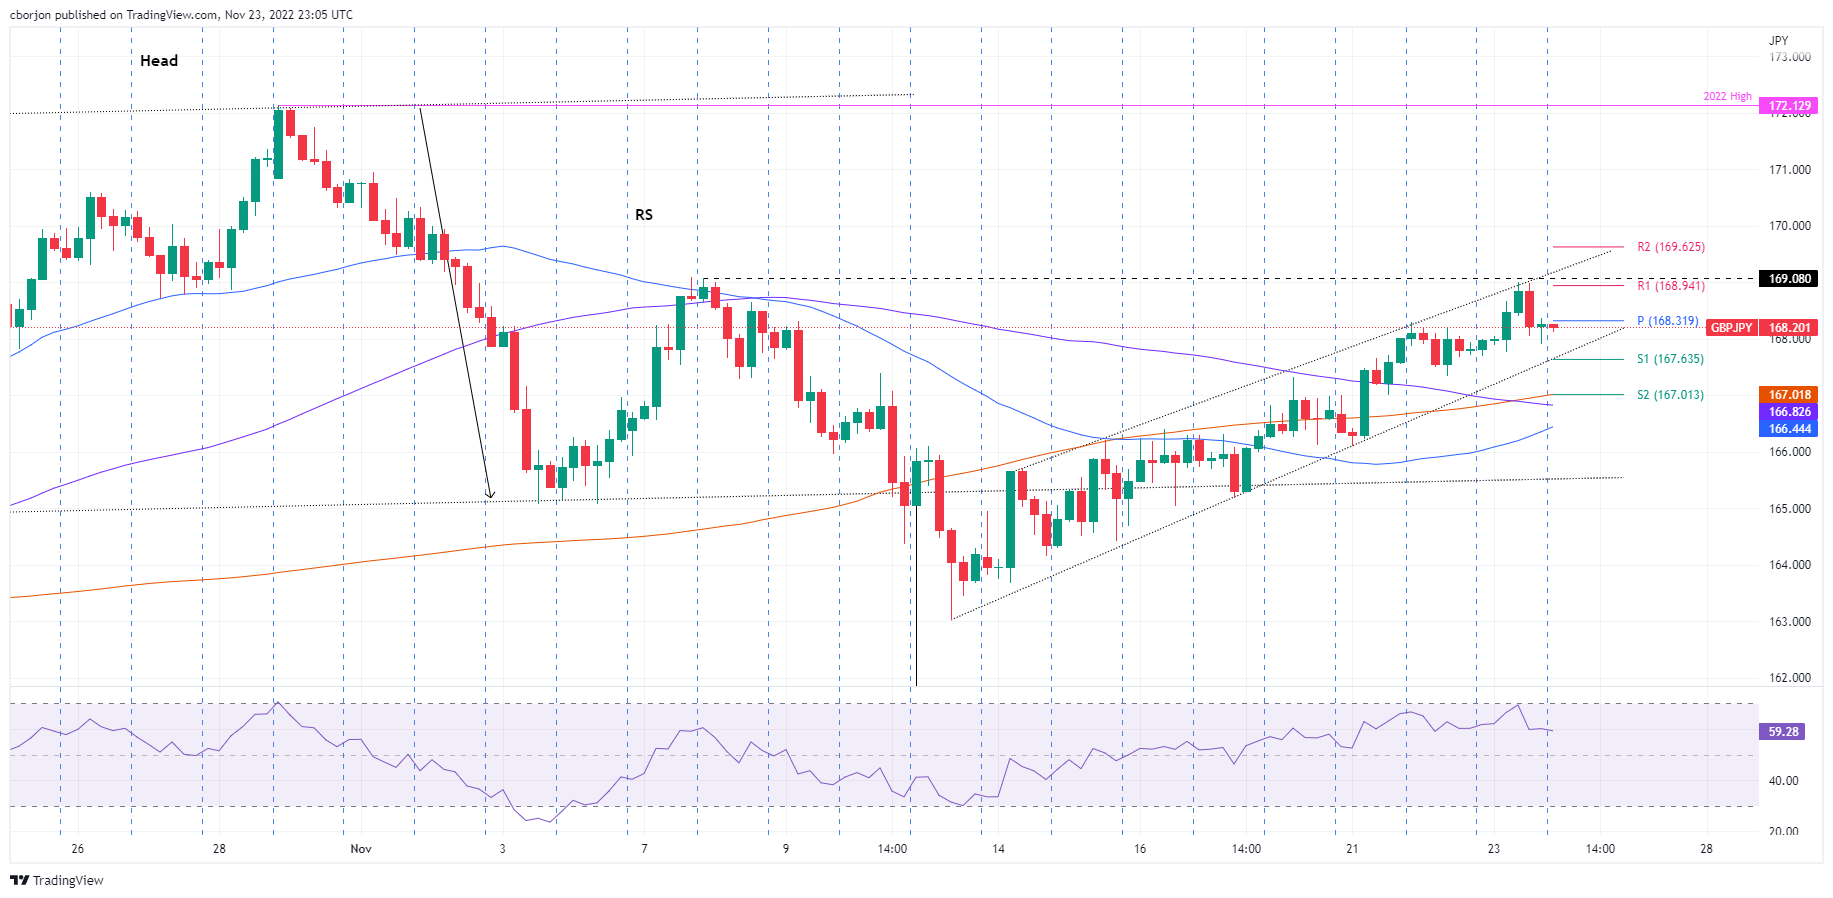
The British Pound (GBP) climbed and tested the head-and-shoulders right shoulder but retreated after sellers stepped in just below the 169.00 figure, exacerbating a fall toward the 168.10 area. Hence, the GBP/JPY is trading at 168.16, registering minuscule losses of 0.04% as the Asian session begins.
GBP/JPY Price Analysis: Technical outlook
The GBP/JPY daily chart remains neutral-to-upward biased. Failure to break above the right shoulder kept the pattern intact; hence, further downside is expected. However, the GBP/JPY must clear the November 23 daily low of 167.69, which would exacerbate a fall towards the head-and-shoulders neckline around 165.30/50. Even though the Relative Strength Index (RSI) is in bullish territory, its slope is flat, closer to the 50-midline. So, if the cross drops below 168.00, the RSI could give a sell signal, exacerbating a fall toward the neckline and beyond.
Short term, the GBP/JPY 4-hour chart depicts the cross advancing steadily on smaller chunks, registering a fresh daily high for the last eight days. On Wednesday, after hitting a daily high of 168.99, the cross plunged 90 pips as sellers stepped in on the top-trendline of an ascending channel. That said, the GBP/JPY is trading below Thursday’s daily pivot point, so the path of least resistance is downwards.
The GBP/JPY first support would be the confluence of the S1 pivot and the upslope trendline around 167.63. Once cleared, the next demand area will be the confluence of the 200-Exponential Moving Average (EMA) and the S2 daily pivot at 167.01.
GBP/JPY Key Technical Levels