- USD Index Price Analysis: The 200-day SMA holds the downside so far
Market news
25 November 2022
USD Index Price Analysis: The 200-day SMA holds the downside so far
- DXY partially sets aside the recent sharp sell-off and regains 106.00.
- The 200-day SMA near 105.30 continues to emerge as a tough support.
DXY finally regains the smile and retakes the area above the 106.00 barrier after three daily drops in a row on Friday.
There is a solid contention area near 105.30, where the November low and the 200-day SMA converge.
In the meantime, the downside pressure in the index is expected to mitigate somewhat once the weekly high at 107.99 is cleared (November 21). Extra gains from here should meet the 100-day SMA at 109.15 ahead of the 9-month resistance line near 110.00.
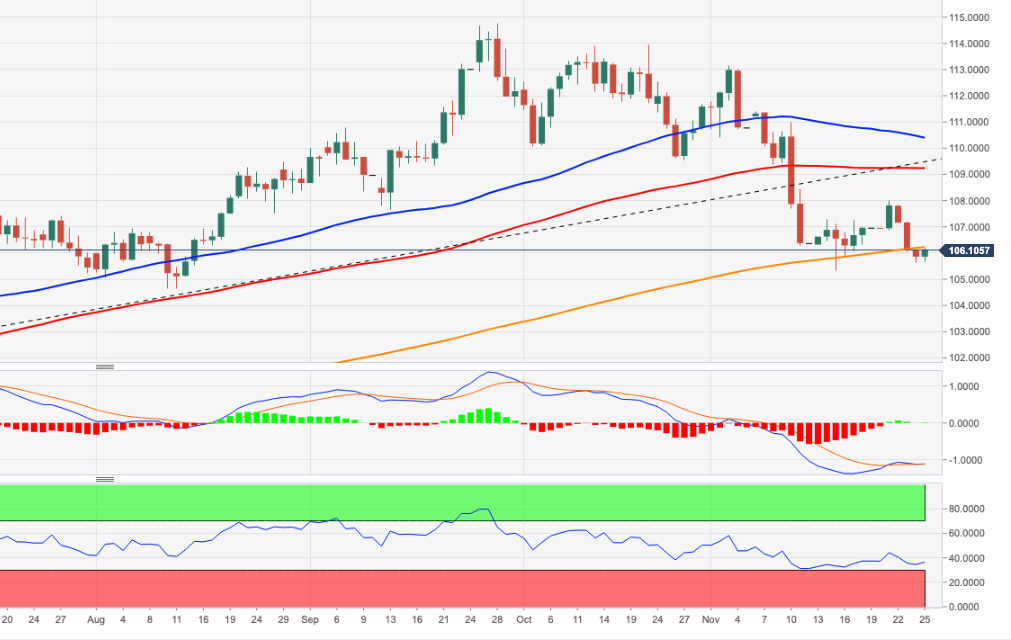
While above the 200-day SMA at 105.32, the outlook for the index should remain constructive.
DXY daily chart
Market Focus
Open Demo Account & Personal Page