- US Dollar Index Price Analysis: DXY recovery needs validation from 21-DMA
Market news
US Dollar Index Price Analysis: DXY recovery needs validation from 21-DMA
- US Dollar Index struggles to extend the upside momentum after rising the most in a week.
- Clear break of three-week-old descending resistance line, bullish MACD signals favor buyers.
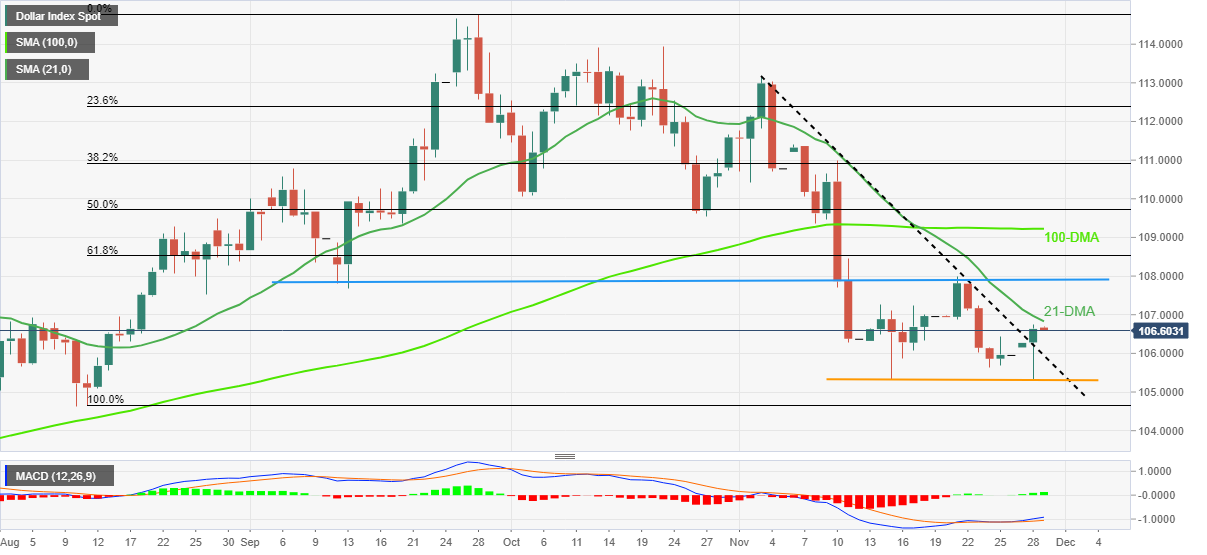
- Double bottoms around 105.30 appear as the key support.
US Dollar Index (DXY) remains sidelined around 106.60 amid early Tuesday, following the biggest daily jump in a week, as bulls seek more clues to extend the latest rebound. Also challenging the upside momentum is the 21-Day Moving Average (DMA).
However, a daily closing beyond the previous resistance line from November 03 joins the bullish MACD signals to suggest further upside of the Greenback’s gauge versus the major six currencies.
It’s worth noting, however, that the 21-DMA hurdle surrounding 106.85 isn’t the ultimate key to the DXY’s rally as a horizontal area established since September 12, near 108.00, could challenge the US Dollar bulls afterward.
Following that, the 61.8% Fibonacci retracement level of the DXY’s August-September upside, near 108.55, could act as the last defense of the bears.
Alternatively, pullback moves may initially aim for the resistance-turned-support line, close to 105.95 by the press time, before revisiting the latest double bottoms marked near 105.30.
In a case where the US Dollar Index remains bearish past 105.30, the odds of witnessing a south-run challenging August month low of 104.63 can’t be ruled out.
US Dollar Index: Daily chart
Trend: Further upside expected