- USD/JPY Price Analysis: A doji around 137.00, capped gains, with sellers eyeing the 200-DMA
Market news
USD/JPY Price Analysis: A doji around 137.00, capped gains, with sellers eyeing the 200-DMA
- Doji, in the USD/JPY daily chart, would it mean consolidation around 136.00-137.00?
- USD/JPY Price Analysis: Positive divergence would exacerbate a rally, but a doji clouds the USD rally.
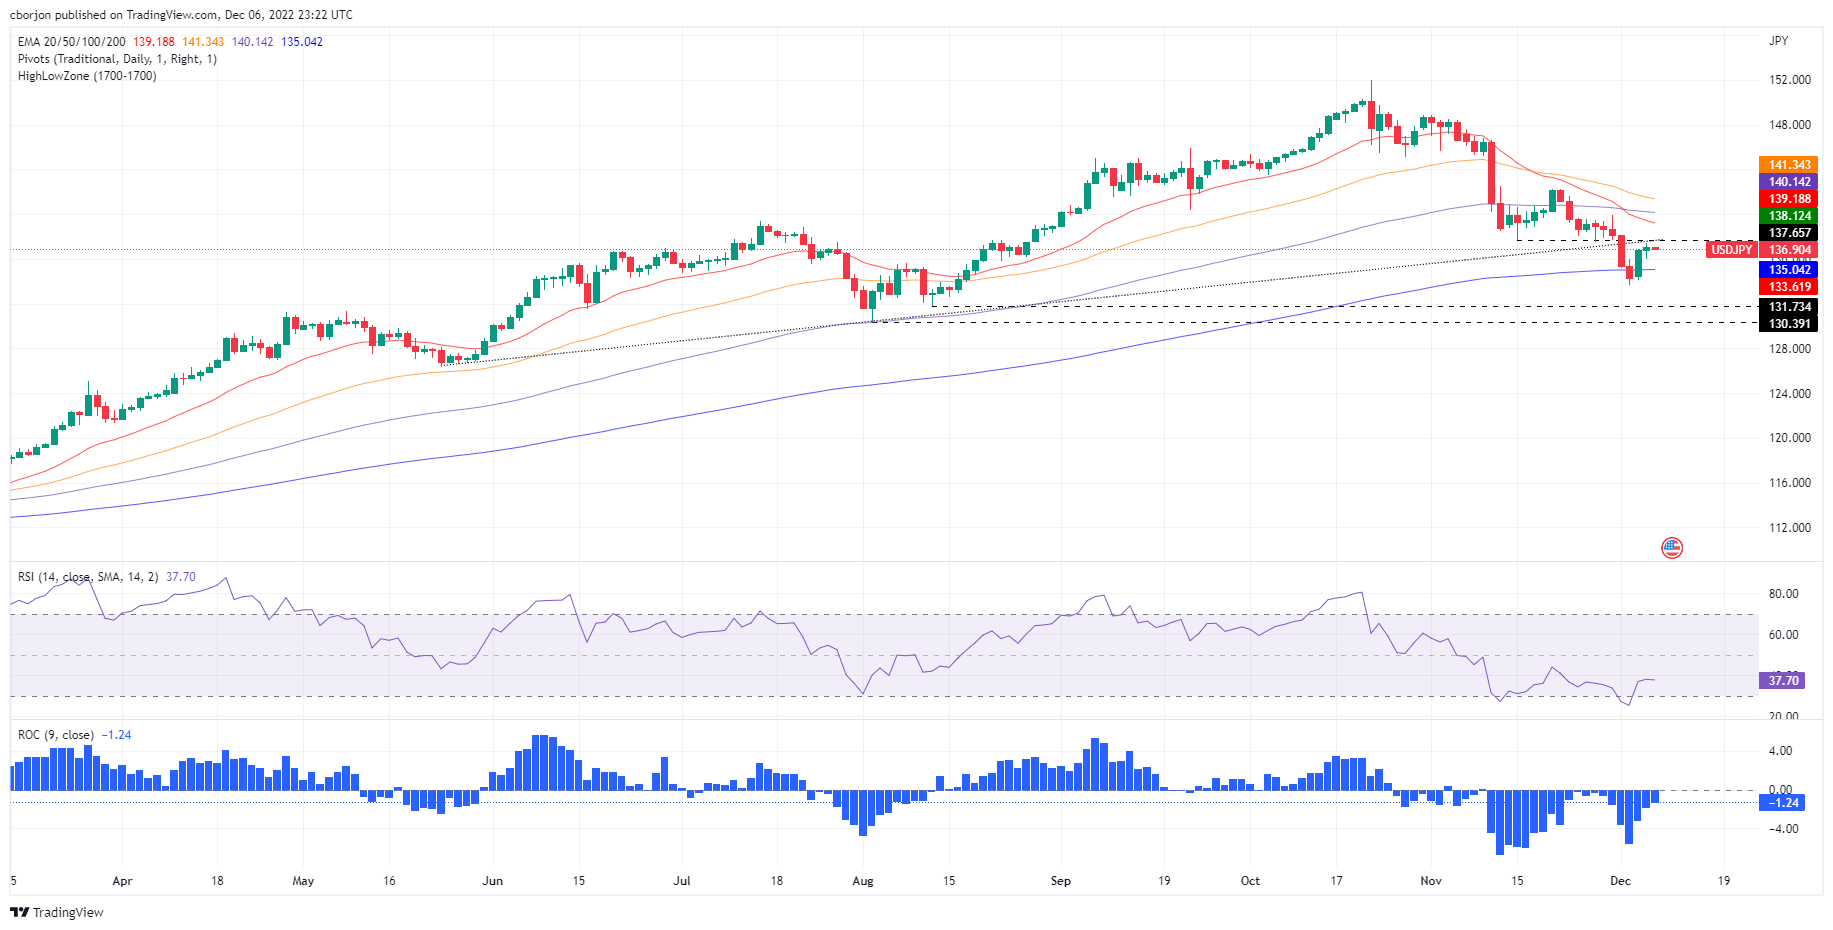
The USD/JPY struck a seven-month-old upslope previous support trendline turned resistance around 137.60, retraced towards its Tuesday daily close at 137.02 for a minuscule 0.02% gain. As the Asian Pacific session begins, the USD/JPY is trading at 136.90, below its opening price by 0.09%.
USD/JPY Price Analysis: Technical outlook
The USD/JPY is neutral-to-upward biased, though a doji emerging in the daily chart suggests the uptrend might halt, or perhaps the USD/JPY might consolidate, around the 136.00-137.00 area. Since mid-November, the USD/JPY registered successive series of lower lows, while the Relative Strength Index (RSI) did the opposite, suggesting that a positive divergence emerged. Furthermore, the Rate of Change (RoC) edges toward zero, implying that selling pressure is fading.
If the USD/JPY clears the weekly high above 137.42, that will invalidate the doji mentioned above and exacerbate a rally toward the 20-day Exponential Moving Average (EMA) at 139.18. Once that resistance level is breached, the next resistance would be the 100-day EMA at 140.14
On the flip side, the USD/JPY first support would be the December 6 daily low of 135.96. A breach of the latter will expose the 200-day EMA at 135.04, followed by the December 2 swing low at 133.61.