- Gold Price Forecast: XAU/USD continues its struggle below $1,850 as investors await FOMC minutes
Market news
Gold Price Forecast: XAU/USD continues its struggle below $1,850 as investors await FOMC minutes
- Gold price is continuously attempting to surpass the critical resistance of $1,850.00.
- The release of the US ISM PMI will trigger a power-pack action in the US Dollar Index.
- A decline is expected in the volume of US ISM Manufacturing PMI data.
Gold price (XAU/USD) has turned sideways around $1,844.00 in the early European session after surpassing the $1,840.00 hurdle. The precious metal continues its struggle for breaking above the crucial resistance of $1,850.00. The gold price is expected to display a decisive move after the release of United States ISM Manufacturing PMI data.
S&P500 futures have attempted a recovery move in the Asian session after a two-day sell-off but still need more filters for attracting a responsive buying action, portraying cautious optimism. The US Dollar Index (DXY) is struggling to sustain above the 104.20 hurdle, sensing pressure due to a fall in the 10-year US Treasury yields below 3.73%.
According to the estimates, the ISM Manufacturing PMI is expected to deepen further to 48.5 from November’s release of 49.0. Shrinking manufacturing activities in the United States are expected to deliver signals of further downside in the inflation projections, which could compel the Federal Reserve (Fed) to a slowdown in the policy tightening measures. However, investors will get more clarity on the monetary policy outlook through Federal Open Market Committee (FOMC) minutes, which will release on Thursday.
Gold technical analysis
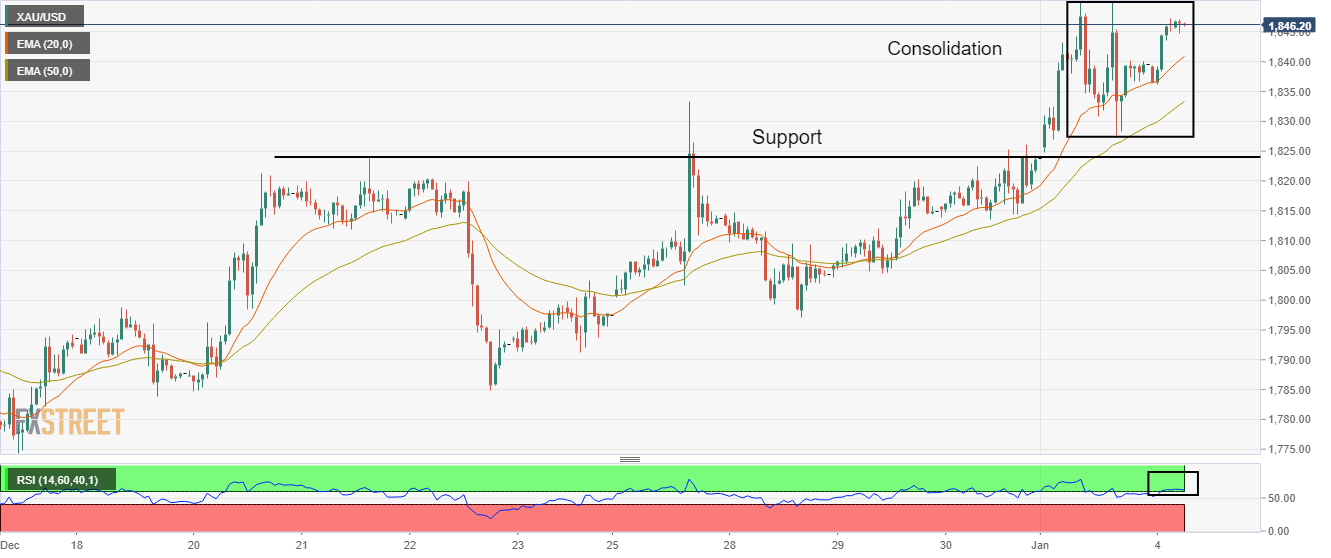
Gold price is displaying a sideways auction profile after a breakout of the horizontal resistance, which has turned into a support area for bulls around $1,824.00. Upward sloping 20-and 50-period Exponential Moving Averages (EMAs) at $1,841.14 and $1,833.50 respectively indicate more upside ahead.
The Relative Strength Index (RSI) (14) has shifted into the bullish range of 60.00-80.00, which signals that the bullish momentum has been triggered.
Gold hourly chart