- Gold Price Forecast: XAU/USD skids below $1870 as yields rebound ahead of Fed Powell’s speech
Market news
Gold Price Forecast: XAU/USD skids below $1870 as yields rebound ahead of Fed Powell’s speech
- Gold price has slipped beneath $1,870.00, weighed down by a recovery in US Treasury yields.
- A rangebound action is expected from the US Dollar Index (DXY) ahead of Fed Powell’s speech.
- Fed policymakers see the terminal rate at 5.00-5.25% to tame stubborn inflation.
Gold price (XAU/USD) has slipped below the immediate resistance of $1,870.00 in the Tokyo session. The precious metal has delivered a breakdown of the consolidation formed in a range of $1,870.00-1,881.50 as the demand for US government bonds is derailing ahead of the speech from Federal Reserve (Fed) chair Jerome Powell, which is scheduled for Tuesday.
The 10-year US Treasury yields have rebounded above 3.54%, weighing on risk-on impulse. Meanwhile, S&P500 futures have turned volatile after witnessing a sell-off in the late Monday session, portraying a caution in building positions in risk-sensitive assets. The US Dollar Index (DXY) is expected to attempt a break into the auction range above the immediate resistance of 103.00.
Investors are awaiting the speech from Fed Powell for fresh cues as it will provide a head-start for the entire CY2023. Well, other Fed policymakers are still favoring the terminal rate projection at 5.00-5.25% despite a significant drop in December wage inflation.
San Francisco Fed Bank President Mary Daly cited that it is reasonable for interest rates to be at 5%-5.25%. Also, Atlanta Federal Reserve bank president Raphael Bostic sees the interest rate peak in a 5%-5.25% range and the continuation of higher interest rates beyond CY2023.
Gold technical analysis
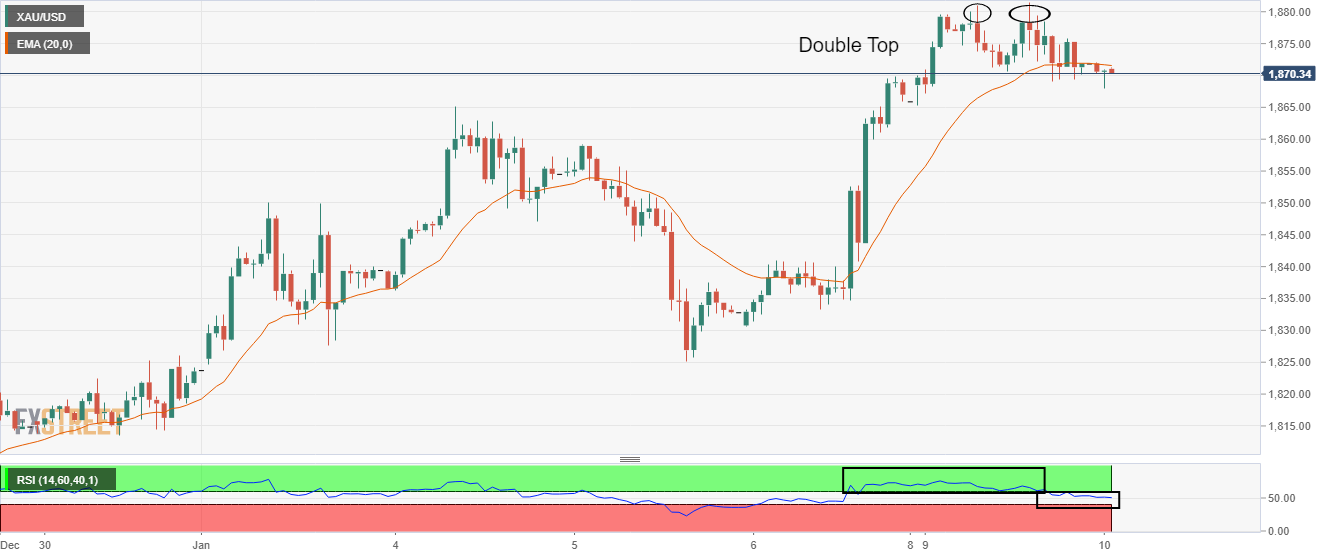
Gold price is displaying signs of exhaustion as selling pressure is visible above $1,880.00. The precious metal has formed a Double Top chart pattern, which indicates a bearish reversal but needs more filters for activation. The yellow metal has slipped below the 20-period Exponential Moving Average (EMA) at $1,871.80, which indicates a correction in the north-side trend.
Also, the Relative Strength Index (RSI) (14) has shifted into the 40.00-60.00 range from the bullish range of 60.00-80.00, which indicates that the bullish momentum has faded.
Gold hourly chart