- Gold Price Forecast: XAU/USD bulls have a bumpy road below $1,920 hurdle – Confluence Detector
Market news
Gold Price Forecast: XAU/USD bulls have a bumpy road below $1,920 hurdle – Confluence Detector
- Gold price remains firmer around multi-month high, fades upside momentum of late.
- Challenges to sentiment, market’s post-inflation consolidation probe XAU/USD bulls.
- Further upside hinges on successful break of $1,918 and more clues for Fed’s next moves.
Gold price (XAU/USD) stabilizes after refreshing the eight-month high as traders seek more clues to defend the weekly rally, the fourth one in a row. Also likely to have weighed the Gold price could be the trade-related fears surrounding China and the Federal Reserve (Fed) policymakers’ hesitance in backing the pivot talks. It’s worth noting, however, that the Fed talks signaled easy rate hikes after a downbeat US Consumer Price Index (CPI) and propelled the XAU/USD prices the previous day. That said, additional US consumer-centric data, like Michigan Consumer Sentiment Index and Retail Sales, eyed to confirm the recent bullish bias over the precious metal.
Also read: Gold Price Forecast: XAU/USD bulls need validation from $1,902 and US inflation expectations
Gold Price: Key levels to watch
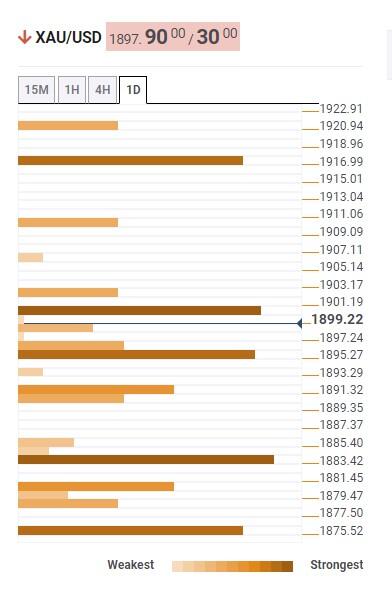
The Technical Confluence Detector shows that the gold price is gathering pace around the $1,900 key hurdle, where the pivot point one-week R2 and Bollinger Band 15-minute Upper merge.
The XAU/USD upside past $1,900 could aim for the $1,917-18 resistance confluence where pivot point one-month R3 acts as the last defense of the Gold bears, a break of which could quickly propel prices to a late March 2022 peak surrounding $1,965.
That said, the pivot-point one-day R1, near $1,910, also acts as an upside filter for the Gold price.
Alternatively, the upper Bollinger Band on one-day joins the Fibonacci 23.6% on one-day to highlight $1,896 as nearby key support.
Following that, a slump towards the $1,881 key level, encompassing the Fibonacci 61.8% on one-day and pivot-point one-week R1, can’t be ruled out.
In a case where the Gold price remains bearish past $1,881, the pivot-point one-month R2, close to $1,875, will act as the last defense of XAU/USD bulls.
Overall, the Gold price remains on the bull’s radar unless breaking $1,875. However, the road towards the north isn’t smooth.
Here is how it looks on the tool
About Technical Confluences Detector
The TCD (Technical Confluences Detector) is a tool to locate and point out those price levels where there is a congestion of indicators, moving averages, Fibonacci levels, Pivot Points, etc. If you are a short-term trader, you will find entry points for counter-trend strategies and hunt a few points at a time. If you are a medium-to-long-term trader, this tool will allow you to know in advance the price levels where a medium-to-long-term trend may stop and rest, where to unwind positions, or where to increase your position size.