- USD/JPY Price Analysis: Remains nearby the bottom of the range, around 131.30s
Market news
USD/JPY Price Analysis: Remains nearby the bottom of the range, around 131.30s
- USD/JPY registers minuscule gains as the Asian session starts after a 0.25% gain on Wednesday.
- USD/JPY: To remain range-bound, trapped within the 20/50-day EMAs.
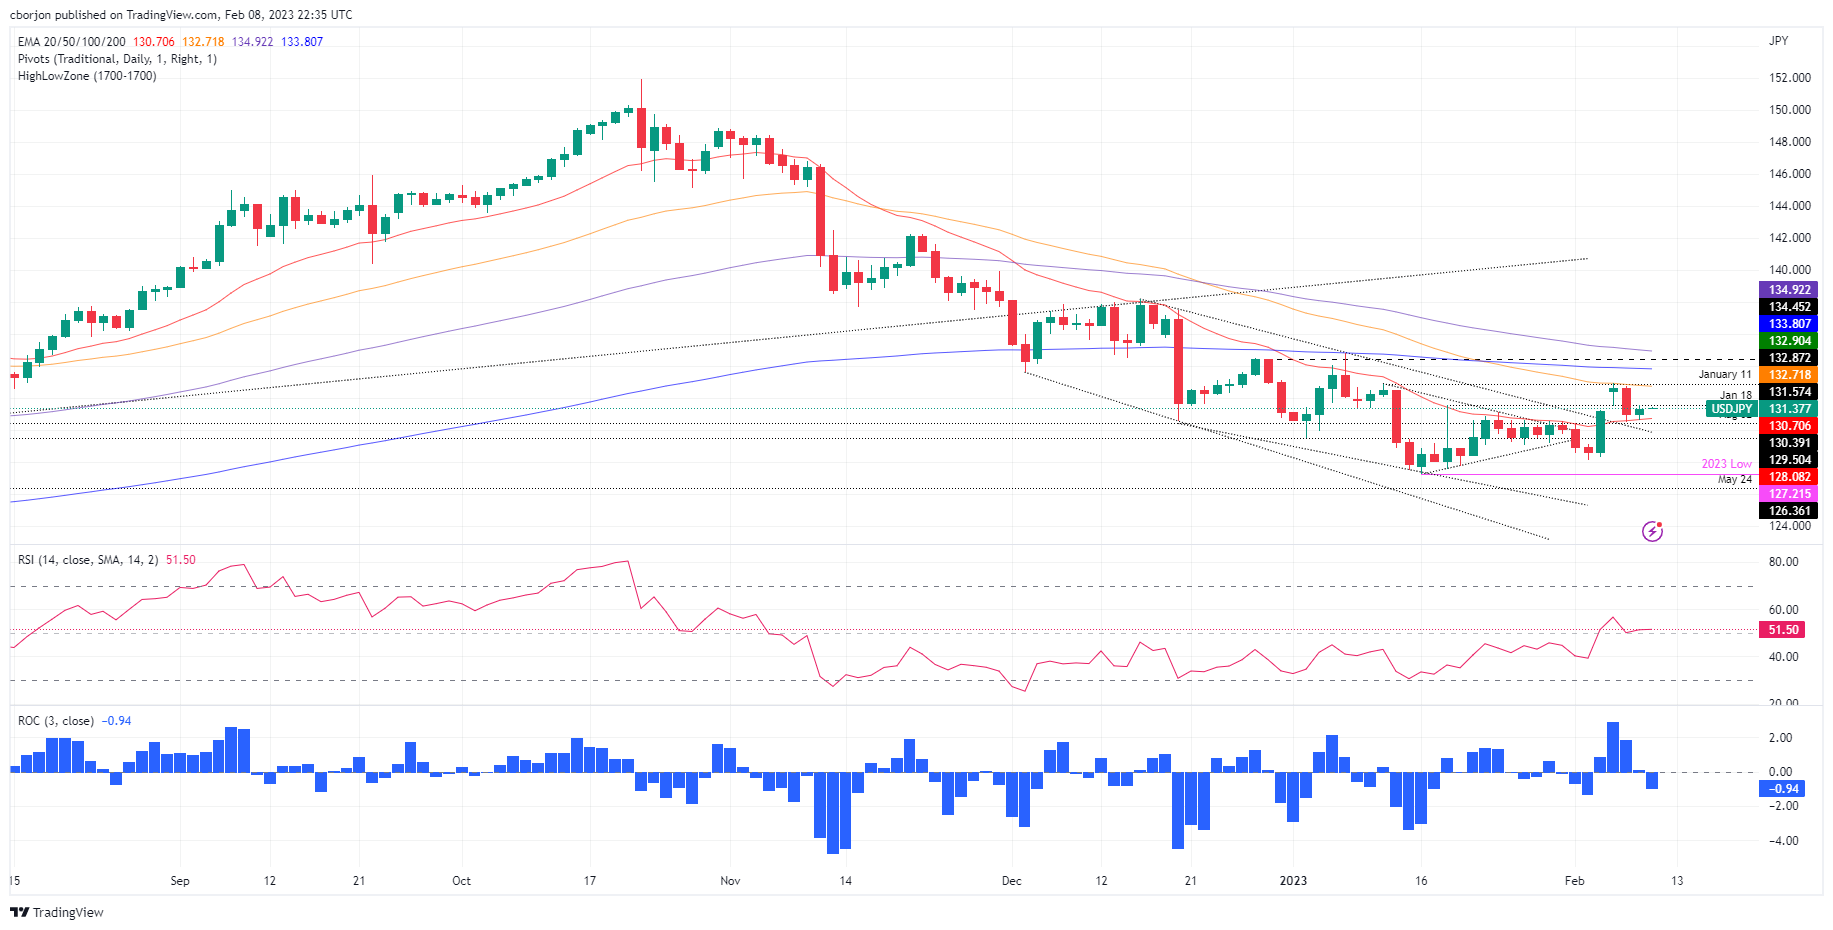
USD/JPY capped its losses at around the 20-day Exponential Moving Average (EMA) on Wednesday and is testing the January 18 daily high of 131.57 as Thursday’s Asian session begins. The USD/JPY is trading at 131.37 after hitting the 20-day EMA at around 130.70.
USD/JPY Price Analysis: Technical outlook
From a daily chart perspective, the USD/JPY entered a consolidation phase following Tuesday’s intervention by Japanese authorities in the FX space. The USD/JPY would likely finish the week trading within the 20/50-day EMAs, each at 130.70-132.72, respectively, amidst the lack of a market-moving event in the financial markets.
Nonetheless, oscillators like the Relative Strength Index (RSI) remain in bullish territory, though a flat slope suggests indecision amongst USD/JPY traders. The Rate of Change (RoC) portrays a scenario of bearish continuation.
If the USD/JPY aims higher, it will face key resistance levels. First, the 132.00 psychological level, followed by the 50-day EMA at 132.72, ahead of the 133.00 figure. On the other hand, a bearish continuation would send the USD/JPY sliding towards 131.00. Break below, and the 20-day EMA would be tested at 130.70. A breach of the latter will expose the 130.00 psychological level.
USD/JPY key technical levels