- Gold Price Forecast: XAU/USD pokes monthly low amid strong United States Treasury bond yields
Market news
Gold Price Forecast: XAU/USD pokes monthly low amid strong United States Treasury bond yields
- Gold price holds lower ground near the six-week bottom, marked the previous day.
- Upbeat United States data, hawkish Federal Reserve bets underpin US Treasury bond yields’ run-up and favor XAU/USD bears.
- Second-tier US statistics may entertain Gold traders ahead of next week’s Federal Open Market Committee (FOMC) Minutes.
Gold price (XAU/USD) remains depressed around $1,835 after posting the biggest daily fall in two weeks around the 1.5-month low. That said, the yellow metal portrays the market’s inaction during early Thursday but stays on the bear’s radar amid firmer United States Treasury bond yields and the US Dollar amid hawkish Federal Reserve (Fed) bets.
Gold price drops as United States data propels Treasury bond yields, US Dollar
Gold price remains on the bear’s radar, despite recent inaction, as upbeat United States economics underpin the hawkish bias surrounding the Federal Reserve’s (Fed) next moves and fuel the US Treasury bond yields, as well as the US Dollar.
That said, US Retail Sales growth jumped to 3.0% YoY in January versus 1.8% expected and -1.1% prior. Further, The Retail Sales ex-Autos grew by 2.3% in the same period, compared to analysts' estimate of +0.8%. On the same line, the NY Empire State Manufacturing Index for February improved to a three-month high of -5.8 versus -18.0 expected and -32.9 market forecasts. Alternatively, the US Industrial Production marked 0.0% MoM figures for January, compared to analysts’ estimate of 0.5% and -0.7% previous readings, but failed to push back the hawkish bias surrounding the Federal Reserve’s (Fed) next move.
Considering the data, the US 10-year Treasury bond yields seesaw around a six-week high, marked the previous day, while the US Dollar Index (DXY) bulls take a breather after rising to a 1.5-month top as the key US data hints at a further increase in the Federal Reserve’s (Fed) interest rates.
That said, the market’s bets on the Fed’s next moves, as per the FEDWATCH tool of Reuters, suggest that the US central bank rates are to peak in July around 5.25% versus the December Federal Reserve prediction of 5.10% top rate.
Geopolitical tension, light calendar also weigh on XAU/USD
Other than the data-backed broad US Dollar strength, the lack of major catalysts and the ongoing US-China tension, as well as the US political risks, also exert downside pressure on the Gold price.
The ongoing chatter surrounding balloon shooting and the story behind the US-China spying recently soured the sentiment. On the same line could be the fears of witnessing the US debt-ceiling crisis, as warned by the US Congressional Budget Office (CBO) on Wednesday per Reuters.
Nothing major to watch for Gold traders ahead of FOMC Minutes
Moving on, the second-tier US data concerning the housing market, industrial activity and producer prices can entertain the Gold traders ahead of the next week’s Minutes of the latest Federal Open Market Committee (FOMC) monetary policy meeting. It’s worth noting that the fresh jump in the Fed bets and upbeat data keeps the XAU/USD bulls hopeful before then.
Gold price technical analysis
Be it a U-turn from the 50-bar Simple Moving Average (SMA) or the clear downside break of a fortnight-old support line, now resistance, the Gold price has it all to challenge the previous monthly low.
Adding strength to the downside bias are the bearish signals from the Moving Average Convergence and Divergence (MACD) indicator. However, oversold conditions of the Relative Strength Index (RSI) line, placed at 14, signal limited room for the XAU/USD towards the south.
As a result, a two-month-old horizontal support area surrounding $1,820 gains the Gold seller’s attention. Should the quote fails to bounce off the stated support zone, lows marked during late December 2022 around $1,797 and $1,785 could lure the XAU/USD bears.
Meanwhile, Gold’s recovery needs validation from the two-week-old support-turned-resistance line, close to $1,847 by the press time.
Even so, a convergence of the 50-SMA and a downward-sloping trend line from February 03, around $1,865, appears a tough nut to crack for the XAU/USD buyers. It should be noted that the 200-SMA level of $1,893 and the $1,900 round figure act as the last defense of the metal sellers.
Overall, the Gold price remains bearish but the downside room appears limited.
Gold price: Four-hour chart
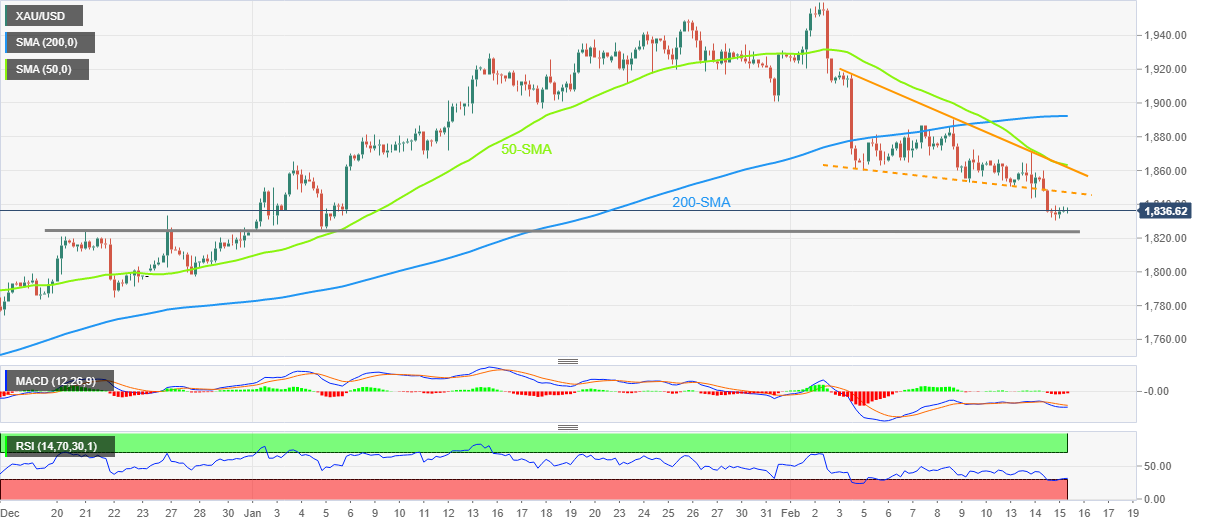
Trend: Limited downside expected