- GBP/USD Price Analysis: Bear flag keeps sellers hopeful, 1.2020 eyed for fresh fall
Market news
GBP/USD Price Analysis: Bear flag keeps sellers hopeful, 1.2020 eyed for fresh fall
- GBP/USD prints mild gains while paring the biggest daily loss in a fortnight.
- Bearish chart formation contradicts bullish MACD signals to challenge immediate run-up.
- Sustained trading beyond 1.2080-85 resistance confluence needed to recall buyers.
GBP/USD remains on the bear’s radar despite the latest rebound to 1.2050, up 0.15% intraday heading into Thursday’s London open. In doing so, the Cable pair struggles to justify the first daily gains in three while consolidating the heaviest slump in two weeks, marked the previous day.
That said, a three-day-old bearish flag chart formation joins the quote’s sustained trading below the weekly support line, now resistance, to keep sellers hopeful. It’s worth noting, however, that the bullish chart formation and the US Dollar’s retreat amid a sluggish session seem to challenge the Cable pair sellers.
As a result, the traders should wait for a clear downside break of the 1.2020 level, comprising the lower line of the flag, to initiate fresh entries.
Following that, January’s bottom surrounding 1.1840 may act as an intermediate halt during the theoretical slump targeting the mid-1.1700s.
Alternatively, the aforementioned support-turned-resistance line from February 07 joins the 200-Hour Moving Average (HMA) to highlight the 1.2080-85 as the short-term key upside hurdle.
In a case where the GBP/USD buyers manage to cross the 1.2085 resistance confluence, they not only defy the bearish chart formation but also strengthen the odds of a run-up toward the weekly top surrounding 1.2270.
GBP/USD: Hourly chart
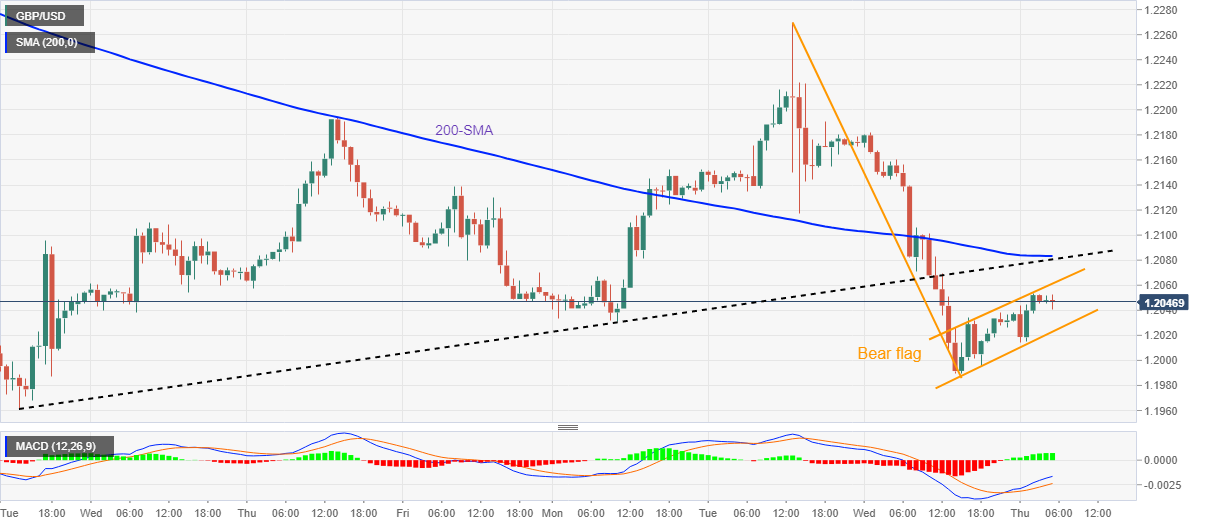
Trend: Further downside expected