- Silver Price Analysis: XAG/USD seems vulnerable near YTD low, break below 50% Fibo. awaited
Market news
Silver Price Analysis: XAG/USD seems vulnerable near YTD low, break below 50% Fibo. awaited
- Silver fails to capitalize on its modest intraday uptick to the 100-day SMA support breakpoint.
- The technical setup supports prospects for an extension of the well-established downtrend.
- Bears, however, might wait for a break below the 50% Fibo. level before placing fresh bets.
Silver struggles for a firm direction on Thursday and seesaws between tepid gains/minor losses heading into the North American session. The white metal is currently placed just above the mid-$21.00s and remains well within the striking distance of its lowest level since November 2022 touched on Wednesday.
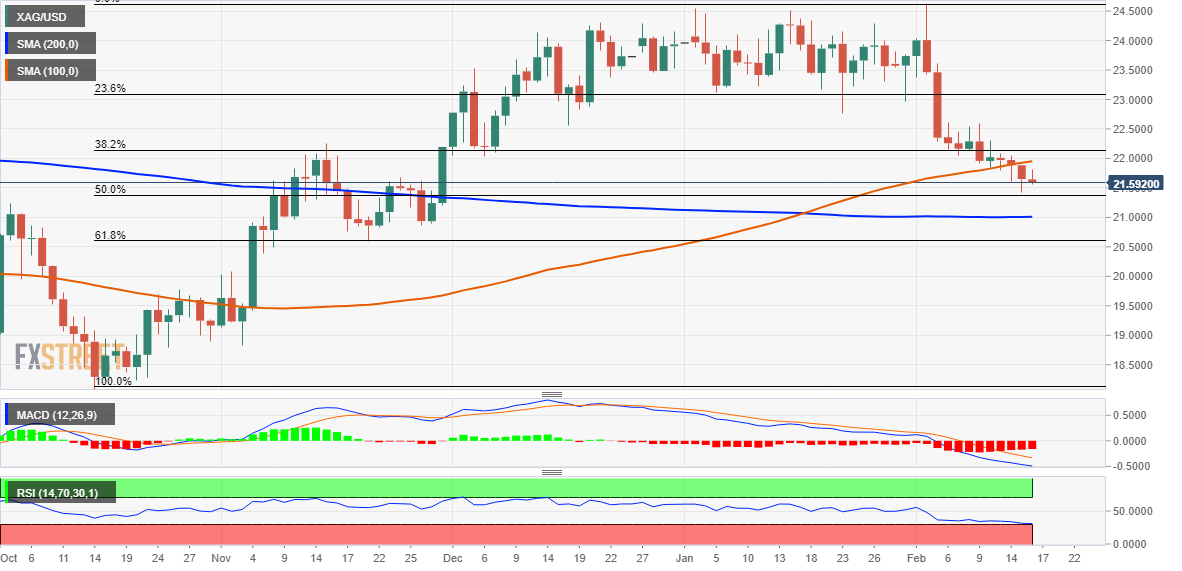
From a technical perspective, the overnight convincing break and acceptance below the 100-day SMA could be seen as a fresh trigger for bears. That said, oscillators on the daily chart have moved on the verge of breaking into oversold territory. This, in turn, assists the XAG/USD to defend the 50% Fibonacci retracement level of the recent rally from October 2022.
This makes it prudent to wait for some follow-through selling below the aforementioned support, around the $21.40 area, before positioning for a further decline. The XAG/USD might then accelerate the slide
towards a technically significant 200-day SMA, currently near the $21.00 mark. Spot prices could eventually drop to 61.8% Fibo. level support around the $20.60 zone.
On the flip side, the 100-day SMA support breakpoint, around the $21.85 region, now seems to act as an immediate hurdle ahead of the $22.00 mark and the 38.2% Fibo., near the $22.15 area. Any further move up might continue to attract fresh sellers near the $22.60-$22.70 supply zone. This, in turn, should cap the XAG/USD near the $23.00 mark, representing the 23.6% Fibo.
That said, a convincing break through the latter could offset the negative outlook and shift the near-term bias in favour of bullish traders. The subsequent move up has the potential to lift the XAG/USD towards the $24.00 round-figure mark. Bulls might then aim back to challenge the $24.50 supply zone, which if cleared decisively should pave the way for a fresh leg up.
Silver daily chart
Key levels to watch