- Gold Price Forecast: XAU/USD approaches $1850 as investors digest a rebound in US Inflation projections
Market news
Gold Price Forecast: XAU/USD approaches $1850 as investors digest a rebound in US Inflation projections
- Gold price is looking to recapture the $1,850.00 resistance despite quiet market mood.
- The USD Index failed to capitalize on escalating geopolitical tensions.
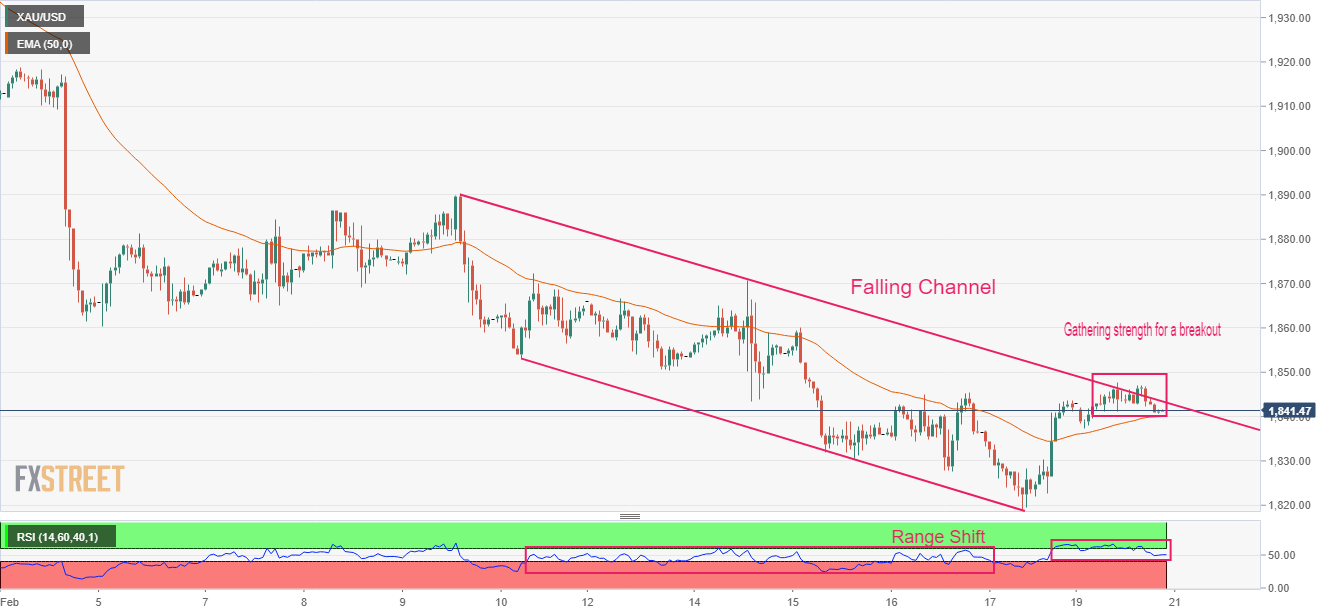
- Gold price is gathering strength to deliver a breakout of the Falling Channel.
Gold price (XAU/USD) has displayed a back-and-forth action in a narrow range above $1,840.00 on Monday’s session. The precious metal is expected to hit the critical resistance of $1,850.00 as investors have digested the fact that the United States inflation could display a surprise rebound after declining consecutively for the past six months.
Last week, the release of the higher-than-anticipated Producer Price Index (PPI) indicated that firms believe that consumer spending is still solid and that wholesale inflation should not be declined extensively. Robust demand from households due to the upbeat labor market is going to keep the expectations of a rebound in the Consumer Price Index (CPI) alive ahead.
Meanwhile, the US Dollar Index (DXY) managed to safeguard the critical support of 103.50. The USD Index didn’t pick strength despite rising geopolitical tensions. The market mood was quiet as the US markets were closed on account of Presidents’ Day. S&P500 futures displayed a volatile session amid uncertainty inspired by an elongated weekend.
For further guidance, investors will focus on the preliminary S&P PMI (Feb) data, which will release on Tuesday. The preliminary Manufacturing PMI (Feb) is seen lower at 46.8 vs. the prior release of 46.9. And the Services PMI is seen at 46.6 against the former release of 46.8.
Gold technical analysis
Gold price is oscillating near the upper end of the Falling Channel chart pattern on an hourly scale. The precious metal is gathering strength to deliver a breakout for a fresh upside. A breakout of the aforementioned chart pattern indicates a bullish reversal. The 50-period Exponential Moving Average (EMA) at $1,840.00 is acting as major support for the Gold bulls.
Meanwhile, the Relative Strength Index (RSI) (14) has demonstrated a range shift structure. The RSI (14) has shifted its structure from the bearish segment of 20.00-60.00 to the bullish arena of 40.00-60.00, in which the 40.00 will act as a support for the US Dollar bulls.
Gold hourly chart
