- Gold Price Forecast: XAU/USD approaches March with sober face below $1,825 hurdle – Confluence Detector
Market news
Gold Price Forecast: XAU/USD approaches March with sober face below $1,825 hurdle – Confluence Detector
- Gold price retreats towards intraday low amid sluggish session, stays on the way to first monthly loss in five.
- A pause in Treasury bond buying, mixed US-China headlines join hawkish Fed bets to keep XAU/USD sellers hopeful.
- Repeated failures to cross $1,825 resistance confluence tease Gold bears as March looms.
Gold price (XAU/USD) remains sluggish as traders brace for a quiet end to the volatile February, after an upbeat start to the week. The yellow metal’s latest weakness could be linked to the mixed concerns surrounding the US-China ties, as well as the unimpressive prints of the second-tier US data. However, hawkish Federal Reserve (Fed) concerns and upbeat US Treasury bond yields, despite the latest inaction, keep the Gold bears hopeful.
Also read: Gold Price Forecast: XAU/USD eyes daily close for Falling Wedge confirmation
Gold Price: Key levels to watch
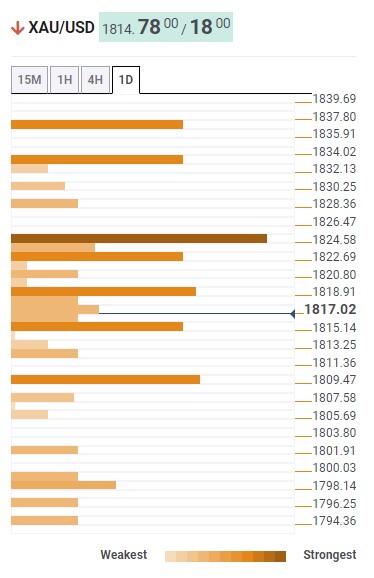
The Technical Confluence Detector shows that the Gold price grinds below the $1,825 resistance confluence which encompasses the Fibonacci 38.2% on one-week and the previous monthly low.
With this, the XAU/USD flirts with Fibonacci 38.2% on one-day, around $1,815, a break of which could quickly drag the metal prices towards $1,809 support level, including the previous weekly low and Pivot Point one-day S1.
In case where the Gold price remains weak past $1,809, there appears a smooth road towards $1,800 threshold comprising Pivot Point one-week S1 and Fibonacci 161% on one-day.
On the flip side, Fibonacci 23.6% on daily and Pivot Point one-day R1 guards immediate upside of the Gold price near $1,820 and $1,822, before highlighting the key $1,825 hurdle.
Should the XAU/USD price remains firmer past $1,825, a convergence of the 10-DMA and Fibonacci 61.8% on one-day, near $1,833, precedes the $1,838 hurdle including Pivot Point one-week R1 and one-day R3 to challenge the bulls.
Overall, the Gold price stays well-set to end February on a negative note.
Here is how it looks on the tool
About Technical Confluences Detector
The TCD (Technical Confluences Detector) is a tool to locate and point out those price levels where there is a congestion of indicators, moving averages, Fibonacci levels, Pivot Points, etc. If you are a short-term trader, you will find entry points for counter-trend strategies and hunt a few points at a time. If you are a medium-to-long-term trader, this tool will allow you to know in advance the price levels where a medium-to-long-term trend may stop and rest, where to unwind positions, or where to increase your position size.