- Silver Price Analysis: XAG/USD hovers around 38.2% Fibo. level, remains below $22.00 mark
Market news
Silver Price Analysis: XAG/USD hovers around 38.2% Fibo. level, remains below $22.00 mark
- Silver seesaws between tepid gains/minor losses below a one-month high touched on Monday.
- Bulls need to wait for a sustained strength beyond the $22.00 mark before placing fresh bets.
- A convincing break below the 23.6% Fibo. will shift the bias back in favour of bearish traders.
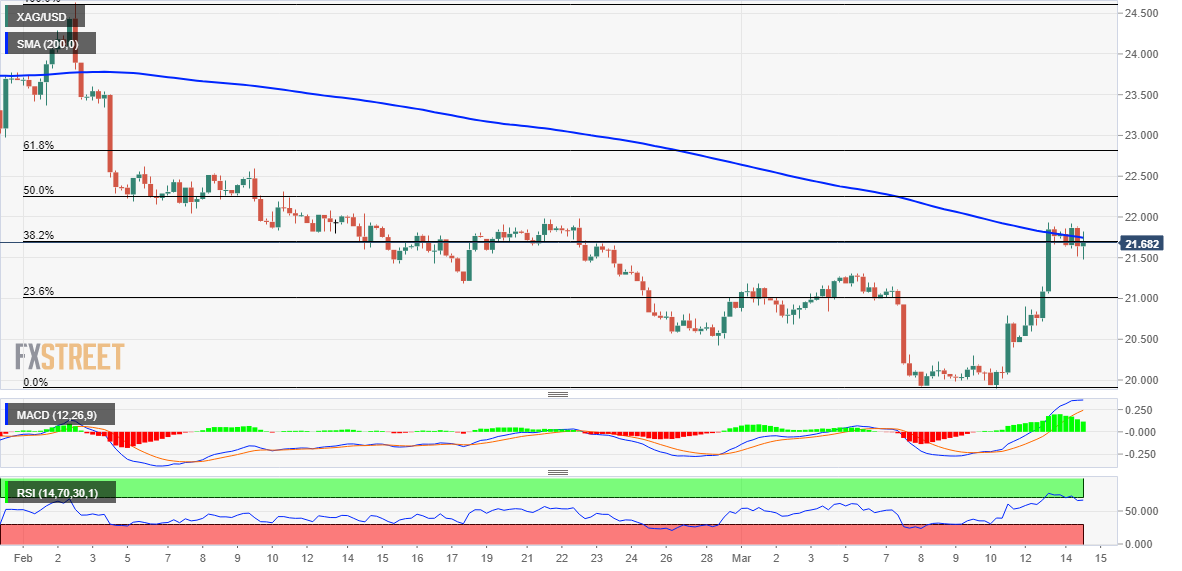
Silver reverses an early North American session dip to the $21.50-$21.45 region and jumps back closer to a one-month high touched the previous day. The white metal, however, remains below the $22.00 round-figure mark and is currently placed around the 38.2% Fibonacci retracement level of the recent downfall from the $24.65 area, or a multi-month peak touched in February.
From a technical perspective, oscillators on the daily chart have just started gaining positive traction and support prospects for additional gains. Bulls, however, might still wait for a sustained move beyond the 200-period Simple Moving Average (SMA) on the 4-hour chart before placing fresh bets. The XAG/USD might then aim to surpass the 50% Fibo. level, around the $22.30 region, and test the next relevant hurdle near the $22.55-$22.60 supply zone. This is followed by 61.8% Fibo. level, just ahead of the $23.00 round figure, which if cleared decisively will negate any near-term bearish bias and pave the way for a further near-term appreciating move.
On the flip side, any weakness below the daily low, around the $21.50-$21.45 zone, might now find some support near the $21.25 area ahead of the $21.00 mark, or the 23.6% Fibo. level. The latter should act as a strong base for the XAG/USD. A convincing break below will suggest that the recent recovery from levels just below the $20.00 psychological mark, or the YTD low touched last week, has run its course. The subsequent slide could drag the XAG/USD towards the $19.60 intermediate support en route to the $19.00 round-figure mark.
The downward trajectory could get extended further towards the $18.80-$18.75 zone before the XAG/USD eventually drops to the next relevant support near the $18.30-$18.25 zone and the $18.00 level.
Silver 4-hour chart
Key levels to watch