- Silver Price Analysis: XAG/USD hovers around $23.30s, unable to break $23.50
Market news
Silver Price Analysis: XAG/USD hovers around $23.30s, unable to break $23.50
- Silver price is trading sideways after hitting a daily high of $23.39.
- XAG/USD Price Analysis: Short term, the XAG/USD might test $24.00 once it reclaims $23.50: otherwise, it would consolidate.
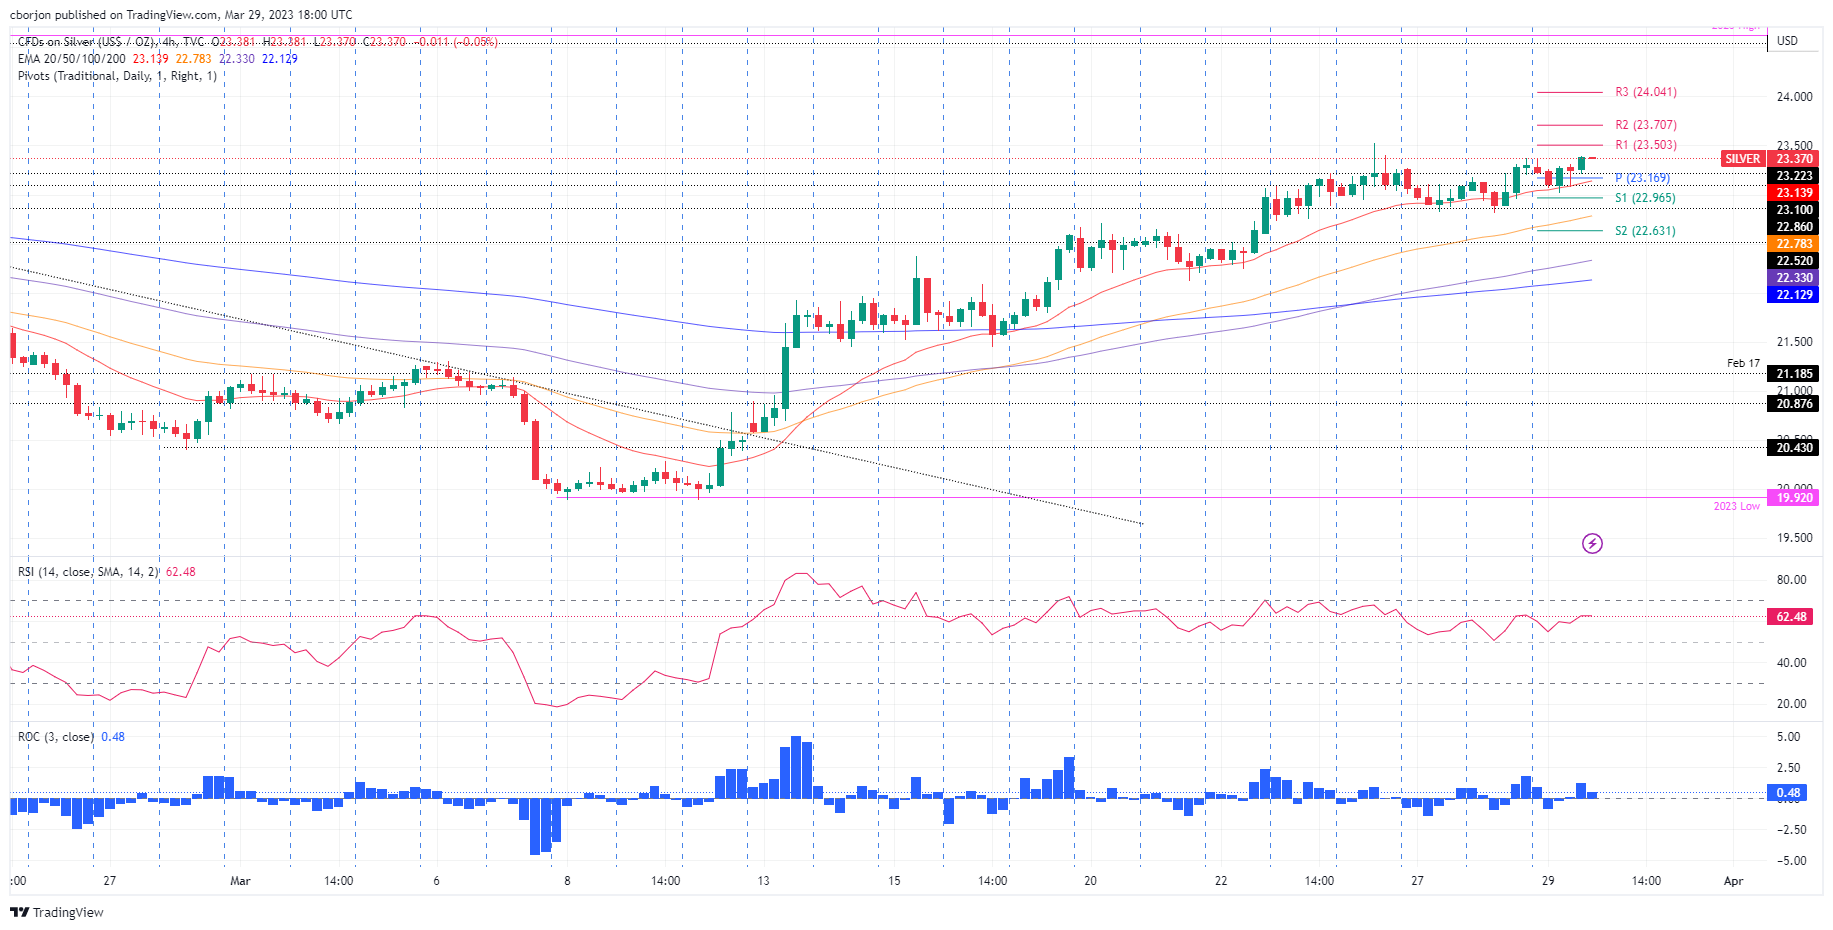
Silver price consolidates for the fourth straight day after hitting a weekly high of $23.52. However, the white metal faces solid resistance and trades sideways on Wednesday. At the time of typing, the XAG/USD is trading at $23.32 for a gain of 0.40%.
XAG/USD Price action
On Wednesday, the XAG/USD failed to sustain the early break above March’s 28 high of $23.37, which would open the door to test the week’s low at $22.83 once sellers break the $23.00 psychological level. That would open the door for a leg down, and if the XAG/USD tumbles below the former, that could exacerbate a test of the 20-day Exponential Moving Average (EMA) at $22.32.
On the flip side, with Silver’s buyers cracking $23.50, upside risks would lie at $24.00, followed by a test of the YTD high at $24.63.
In the short term, the XAG/USD 4-hour chart portrays the white metal as neutral to upward bias, and it might test $23.50 soon. A breach of the latter will clear the path to test higher pivot points, like #2 at $23.70, before assaulting R3 at $24.04.
XAG/USD 4-hour chart
XAG/USD Technical levels