- GBP/USD Price Analysis: Bumpy ride ahead on a break of structure below 1.2300
Market news
GBP/USD Price Analysis: Bumpy ride ahead on a break of structure below 1.2300
- GBP/USD has faced barricades near 1.2300 after an attempt of recovery.
- S&P500 futures are holding onto losses generated in the Asian session, portraying a cautious market mood.
- The USD Index has refreshed its weekly high above 103.00 as higher US inflation expectations were prompted by upbeat oil prices.
The GBP/USD pair has slipped sharply below the round-level support of 1.2300 in the Asian session. The Cable went through turbulent times as investors shifted their funds into the US Dollar Index (DXY) in hopes that the Federal Reserve (Fed) will hike rates further dramatically.
The USD Index has refreshed its weekly high above 103.00 as higher United States inflation expectations were prompted by upbeat oil prices. Acceleration in the oil price is expected to fuel inflationary pressures as producers would offset the impact of costly oil by hiking prices of goods and services at factory gates.
S&P500 futures are holding onto losses generated in the Asian session, portraying a cautious market mood. The cable is expected to face sheer volatility ahead of the US ISM Manufacturing PMI data. The economic data provide cues about forward demand for goods, which is likely to contract firmly to 44.6 vs. the prior release of 47.00. Subdued consensus for the US Manufacturing PMI could be the outcome of higher interest rates by the Fed for bringing down persistent inflation.
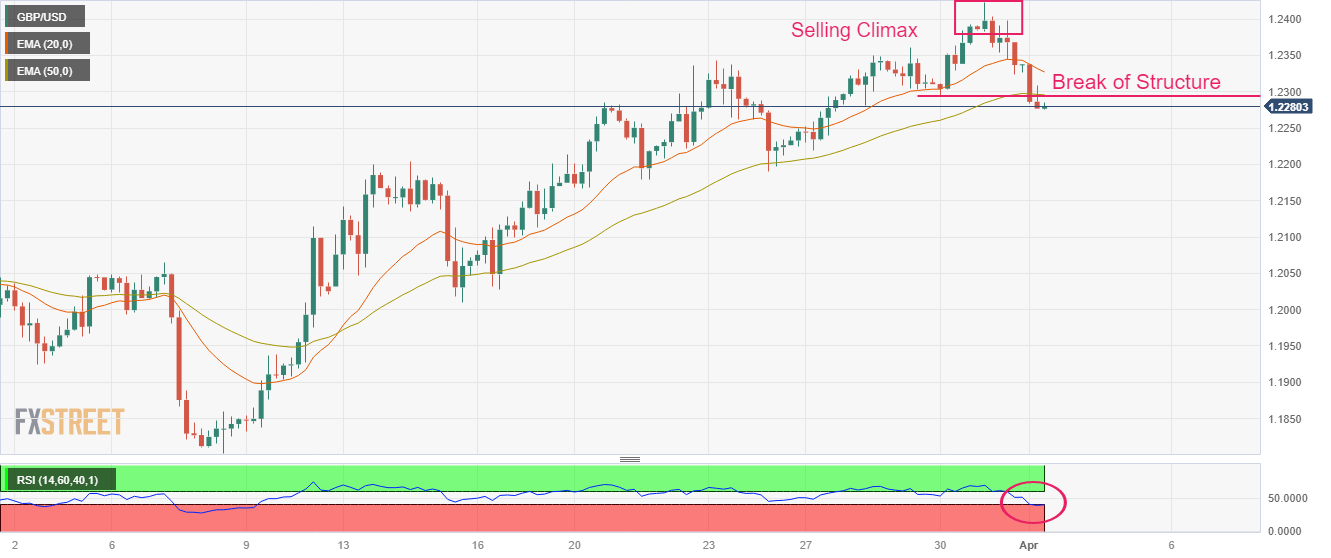
GBP/USD started declining after observing the presence of responsive sellers around March 31 high at 1.2424. The higher High Higher Low structure in the GBP/USD pair has broken after slipping below March 30 low around 1.2300 and the Cable is expected to attract more downside bets ahead.
The Cable has also slipped firmly below the 20-and 50-period Exponential Moving Averages (EMAs) at 1.2327 and 1.2300 respectively, which indicates that the short-term trend has turned bearish.
Also, the Relative Strength Index (RSI) (14) has slipped into the bearish range of 20.00-40.00, which indicates that the downside momentum has been triggered.
Going forward, a break below March 23 low at 1.2261 will accelerate the downside in the Cable toward the round-level support at 1.2200 and March 10 high at 1.2113.
Alternatively, a move above March 29 high at 1.2362 would drive the Cable toward March 31 high at 1.2424 followed by the psychological resistance at 1.2500.
GBP/USD four-hour chart