- NZD/USD Price Analysis: Bulls are in control but are flirting with key resistance
Market news
NZD/USD Price Analysis: Bulls are in control but are flirting with key resistance
- NZD/USD is rising the US Dollar´s weakness at the start of the week.
- NZD/USD bulls need to commit on the front side of the trend.
NZD/USD rallied on the back of a weaker US Dollar in the wake of soft ISM data. At the same time, the commodities sector bounced, led by oil which was supportive of the Kiwi.
´´ The question now is; will a hawkish RBNZ tomorrow give the Kiwi the “escape velocity” it needs to break above 0.63? It may well do, especially if US bond yields continue to fall and markets there fret about financial instability,´´ analysts at ANZ bank argued.
Meanwhile, the technical picture is a short-term bearish, medium-term bullish, but back to bearish again longer term as per the following analysis:
NZD/USD daily chart
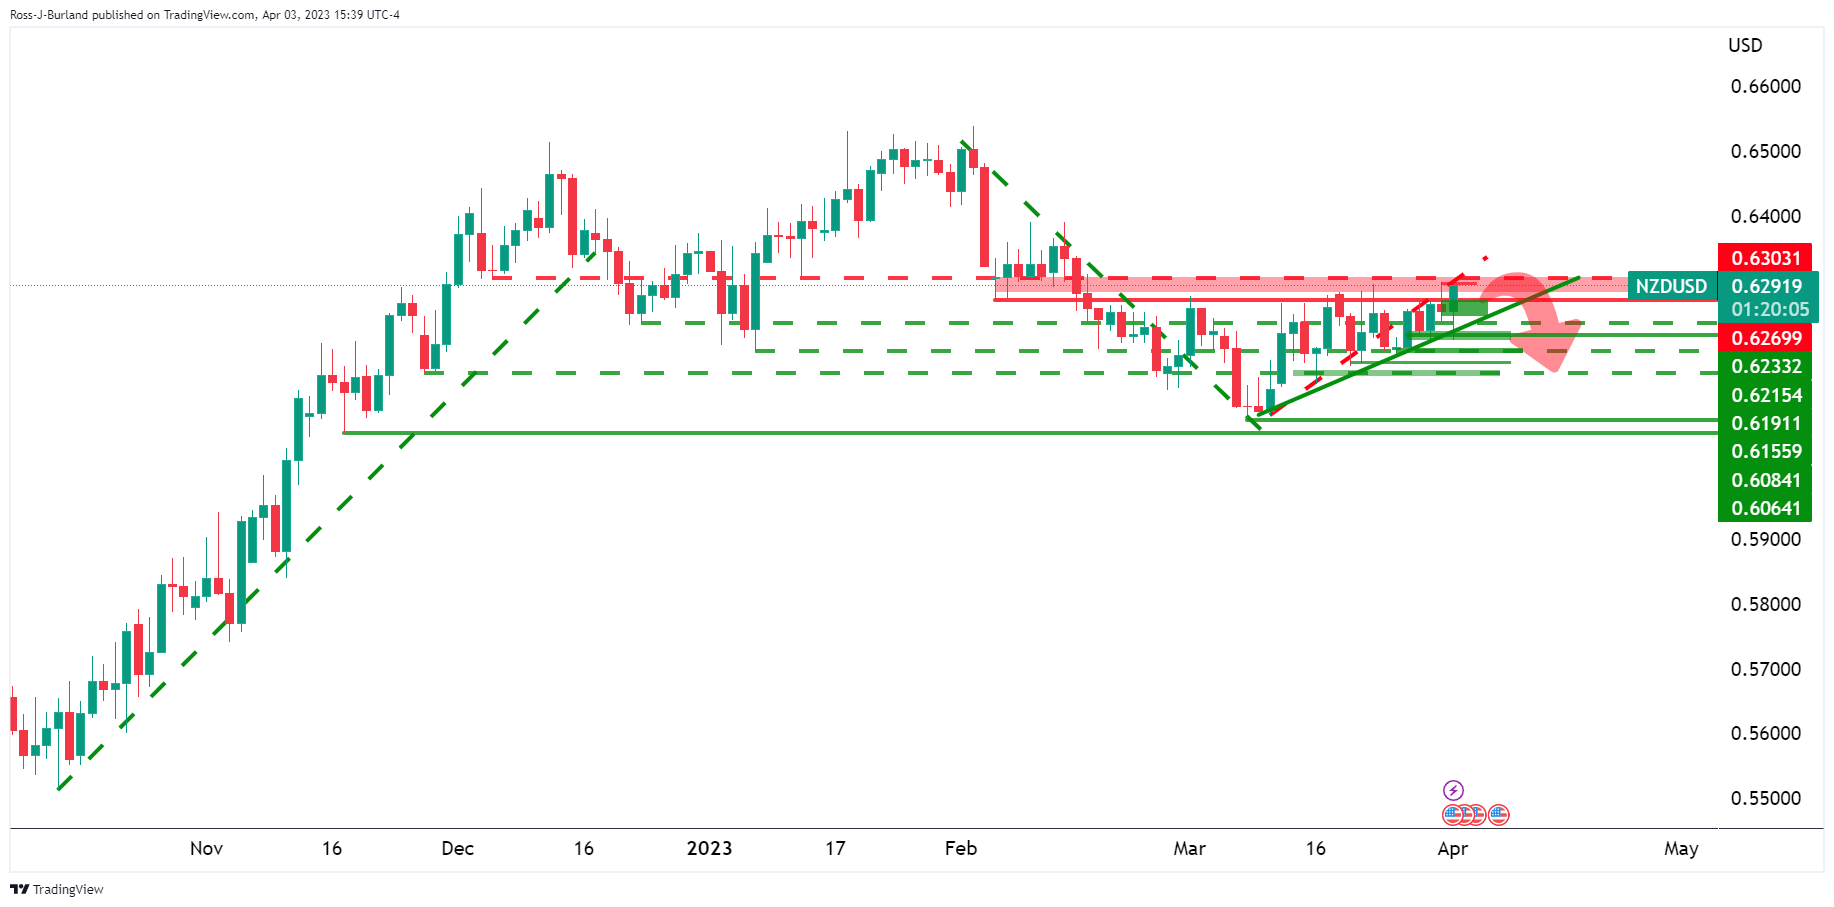
The Kiwi is bullish while on the front side of the trendline but it is running into an area of resistance as per the daily chart above. A break of the trendline support would be a significant bearish development if it occurs after failures above 0.6300 resistance.
NZD/USD H4 charts
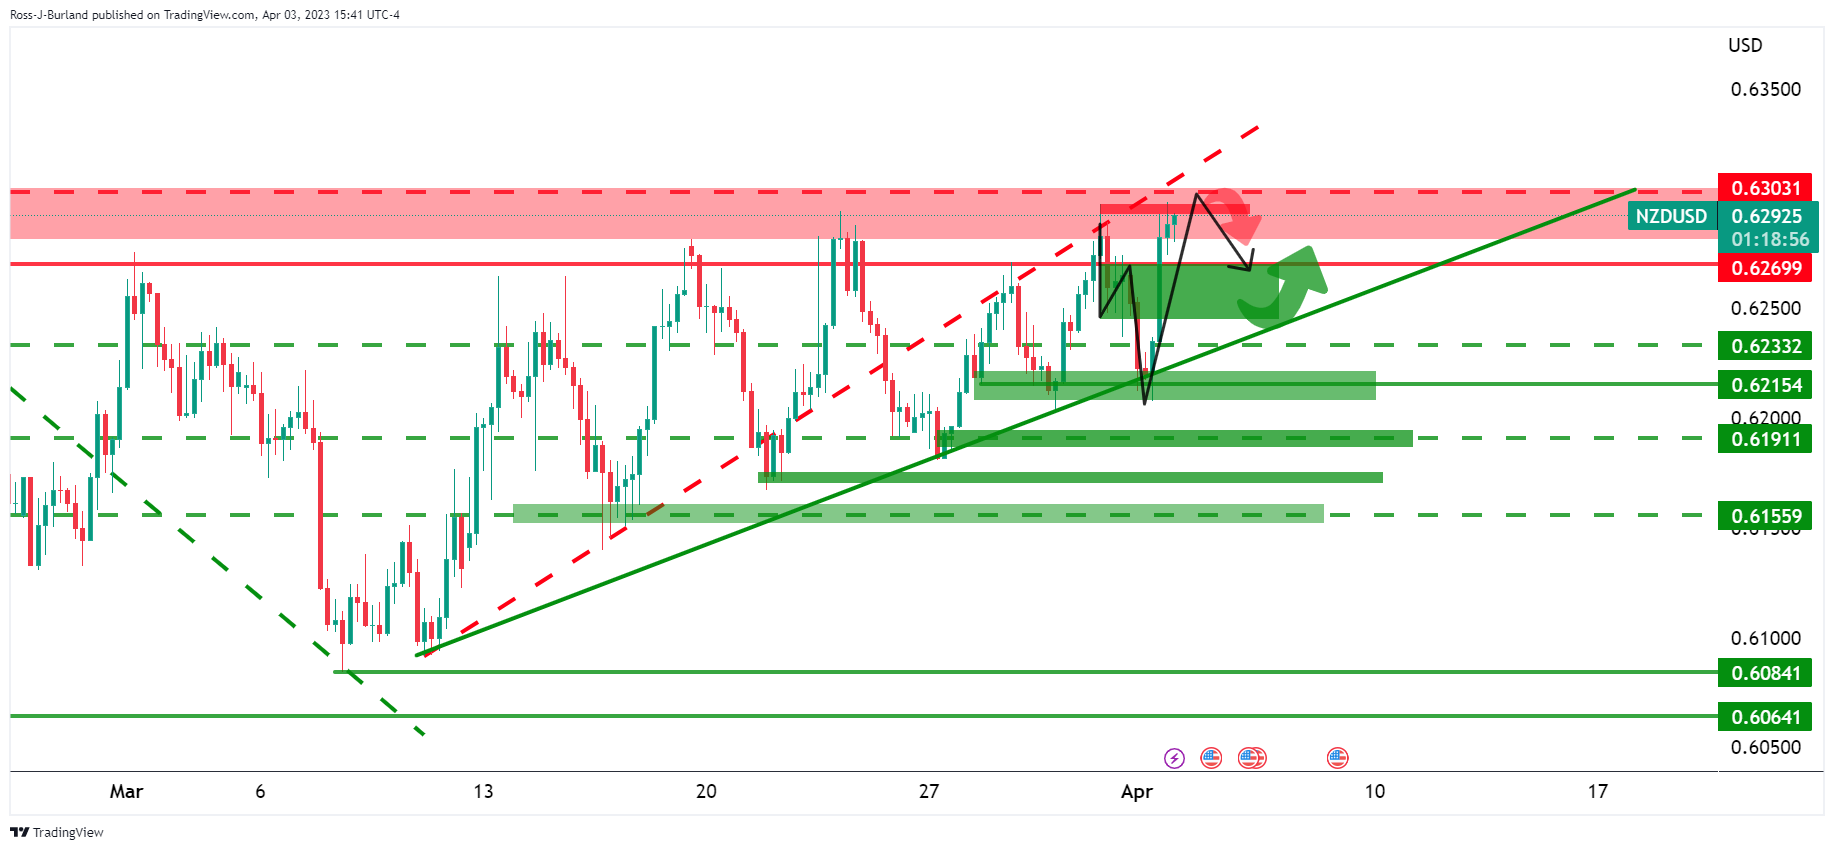
The 4-hour chart has left a W-formation at what could be the top of the bullish cycle. This is a reversion pattern and would be expected to be a pull on the price at resistance.
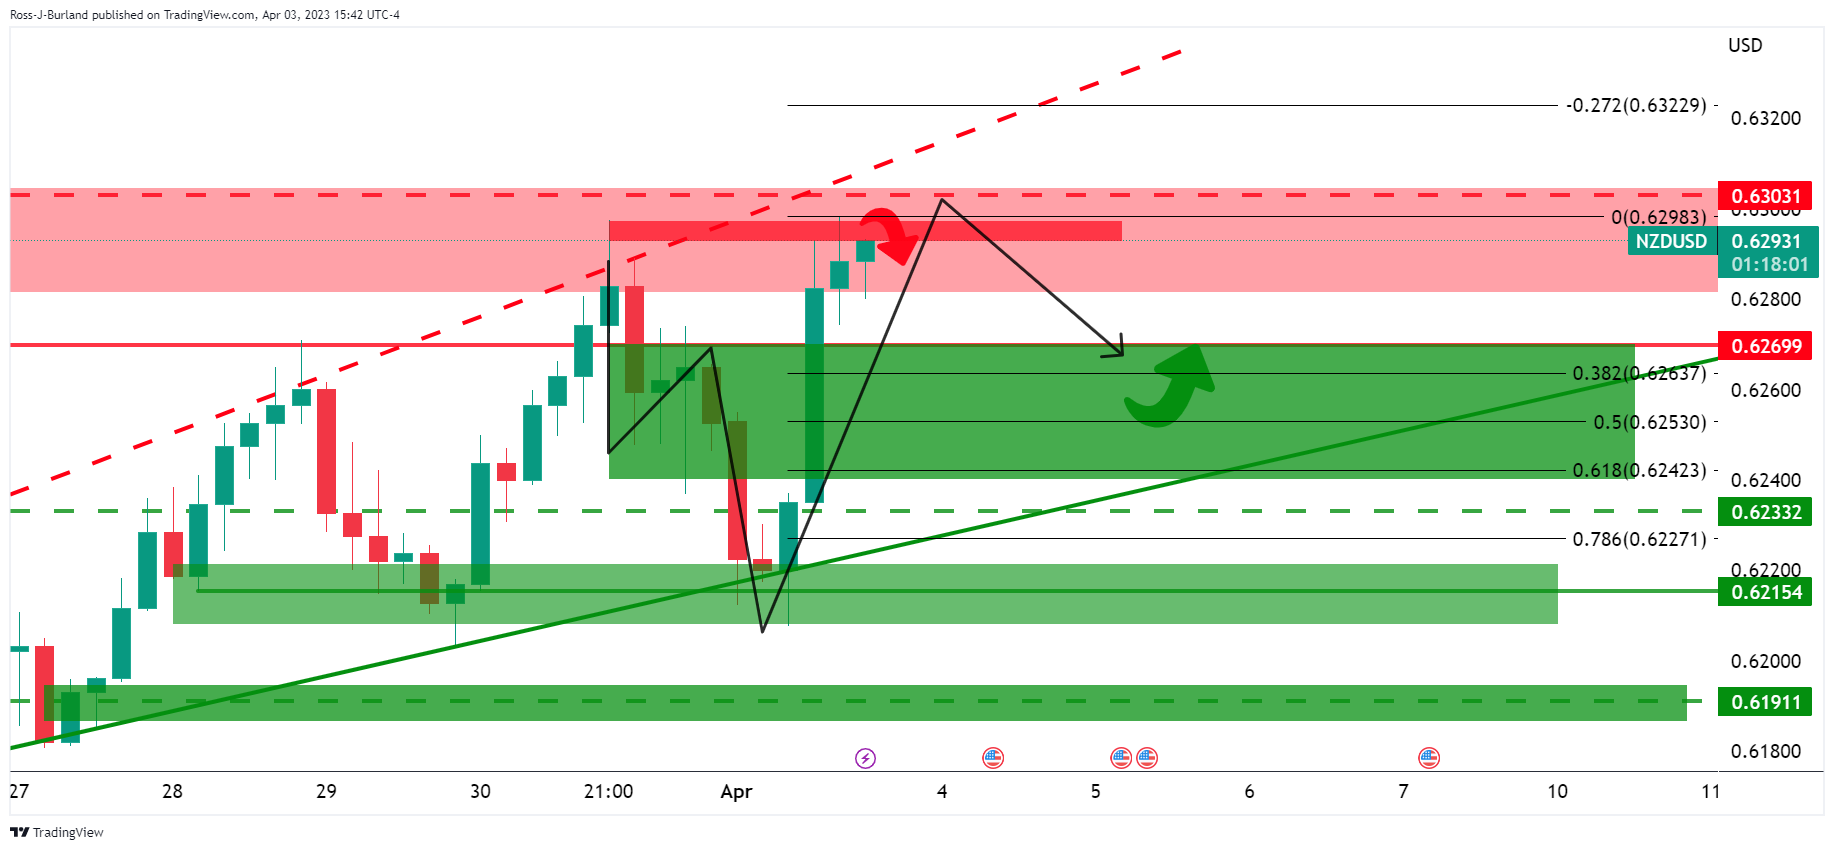
Zooming in, however, should the bulls commit on the front side of the trend and within the Fibonacci scale, then there will be prospects of another test of the resistance area and a break thereof would open the doors for a bullish continuation, on the front side of the bullish trend.