- GBP/USD Price Analysis: Bulls have limited room towards the north, 1.2550 in focus
Market news
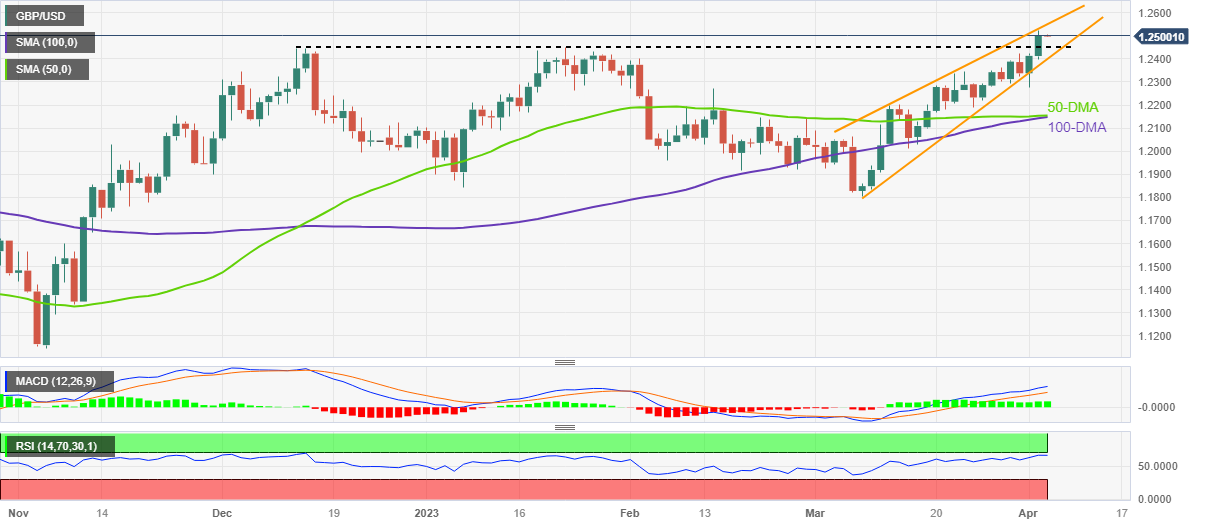
GBP/USD Price Analysis: Bulls have limited room towards the north, 1.2550 in focus
- GBP/USD bulls take a breather at 10-month high, seesaws after rising the most in three weeks.
- Clear upside break of 1.2445-50 horizontal hurdle, bullish MACD signals favor Cable pair buyers.
- Rising wedge, overbought RSI teases sellers to take a risk and aim for 50-DMA, 100-DMA convergence.
GBP/USD buyers sit tightly in the driver’s seat while riding along the lines of the highest levels since June 2022, sidelined near 1.2500 during early Wednesday.
The Cable pair marked the biggest daily gains in three weeks the previous day after crossing an important horizontal resistance comprising multiple tops marked since mid-December 2022, now immediate support around 1.2450-45. Adding strength to the upside momentum were the bullish MACD signals.
It’s worth noting, however, that the RSI (14) line is near the overbought territory and suggests a pullback in the GBP/USD prices before mark the next leg towards the north. Also teasing the Cable pair sellers is the existence of a one-month-old rising wedge bearish chart pattern, currently between 1.2550 and 1.2390.
Should the quote drops below 1.2390, it confirms the bearish formation and can refresh the 2023 bottom, around 1.1800 by the press time. However, a convergence of the 50-DMA and the 100-DMA, close to 1.2155-50 acts as an important support to watch during the anticipated fall.
On the flip side, a clear upside break of the 1.2550 hurdle, comprising the stated wedge’s top line, defies the bearish chart pattern and can propel the GBP/USD prices toward the May 2022 high of around 1.2665.
That said, the 1.2600 round figure and September 2020 low near 1.2675 act as extra upside filters for the Cable pair buyers to watch during the quote’s further upside.
GBP/USD: Daily chart
Trend: Limited upside expected