- USD/JPY Price Analysis: Bulls eye a run to test 134.00 with eyes on US CPI
Market news
USD/JPY Price Analysis: Bulls eye a run to test 134.00 with eyes on US CPI
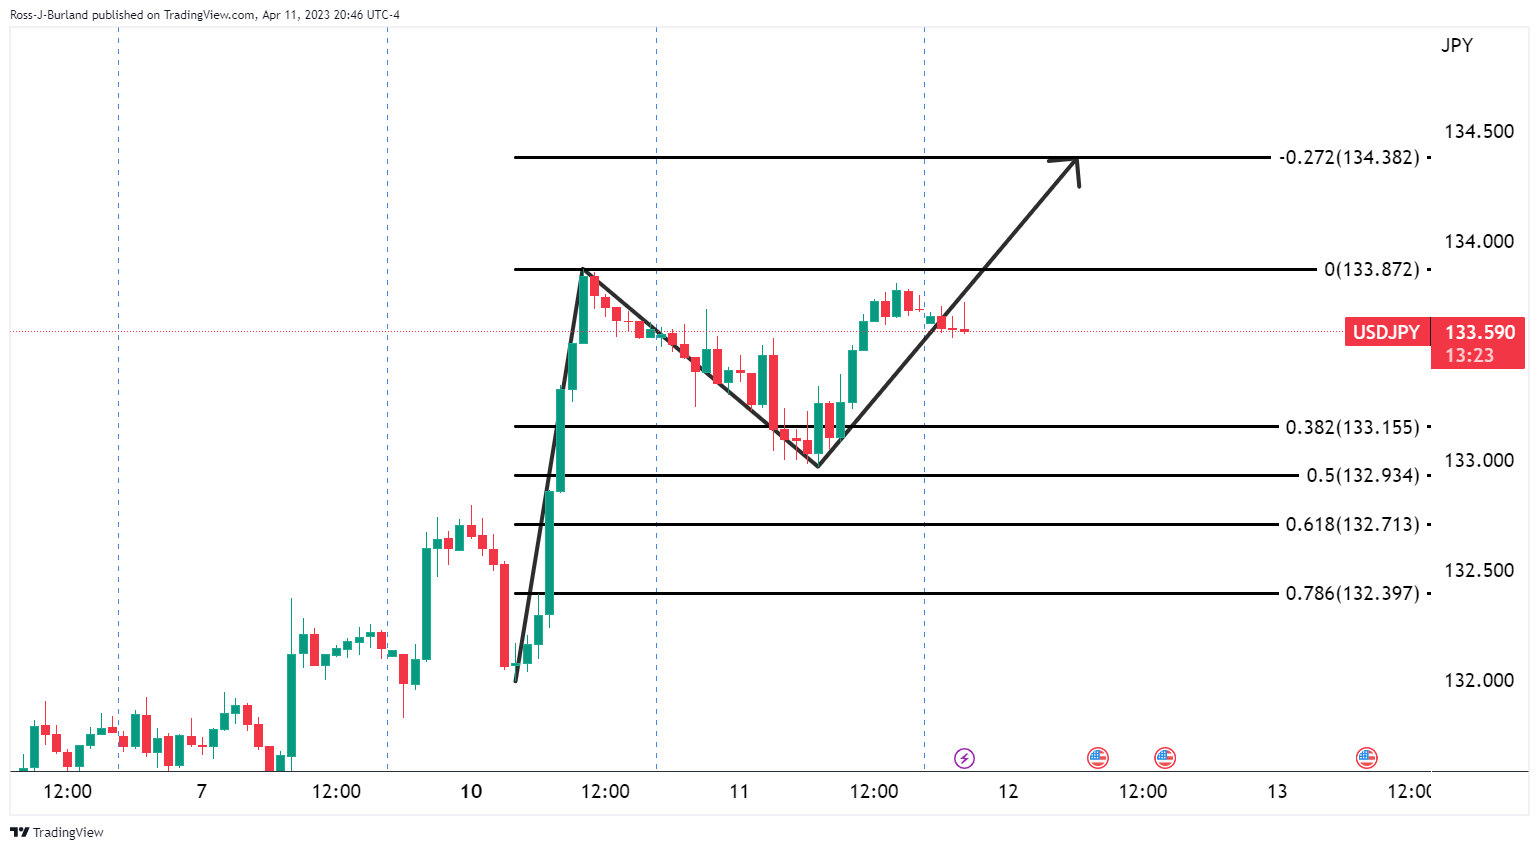
- USD/JPY hourly chart shows that the price could still correct deeper into support.
- Eyes on the 38.2% Fibo of the latest bullish impùlse aligned with the 133.50s.
- Bull looks to 134.00 for the near-term upside target.
USD/JPY is at 133.60, up from 133.26 as of Tuesday's Tokyo stock market close but flat on the day so far. Traders are focusing on the US consumer inflation due later in the day, but the technicals are pointed to the upside as the following top-down analysis illustrates.
USD/JPY weekly chart
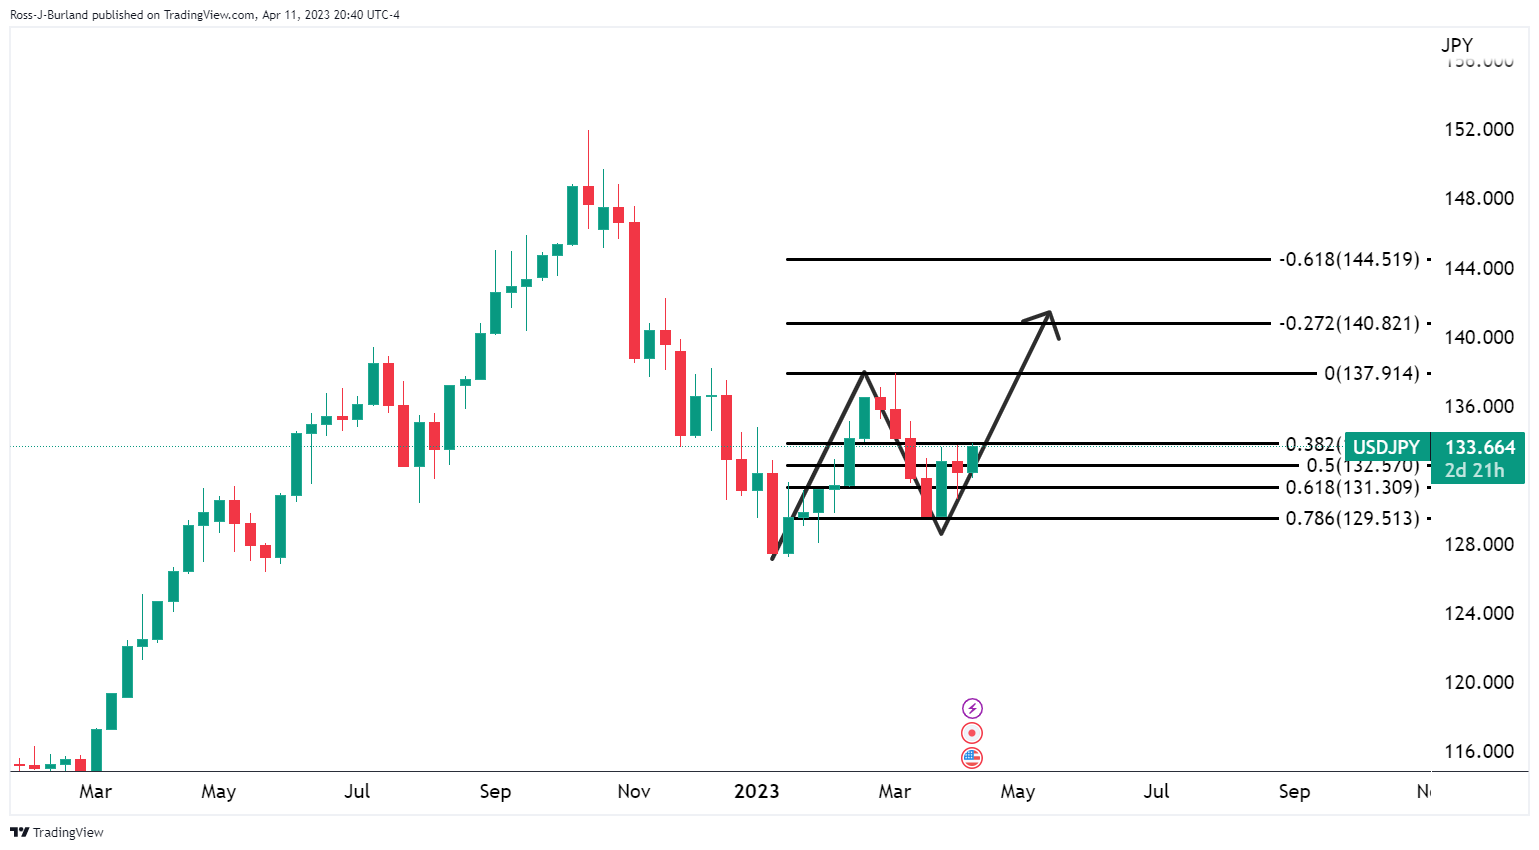
The weekly chart is showing that the price found support at a 78.6% Fibonacci retracement level of the prior weekly bullish impulse. This is bullish for the foreseeable future.
USD/JPY daily charts
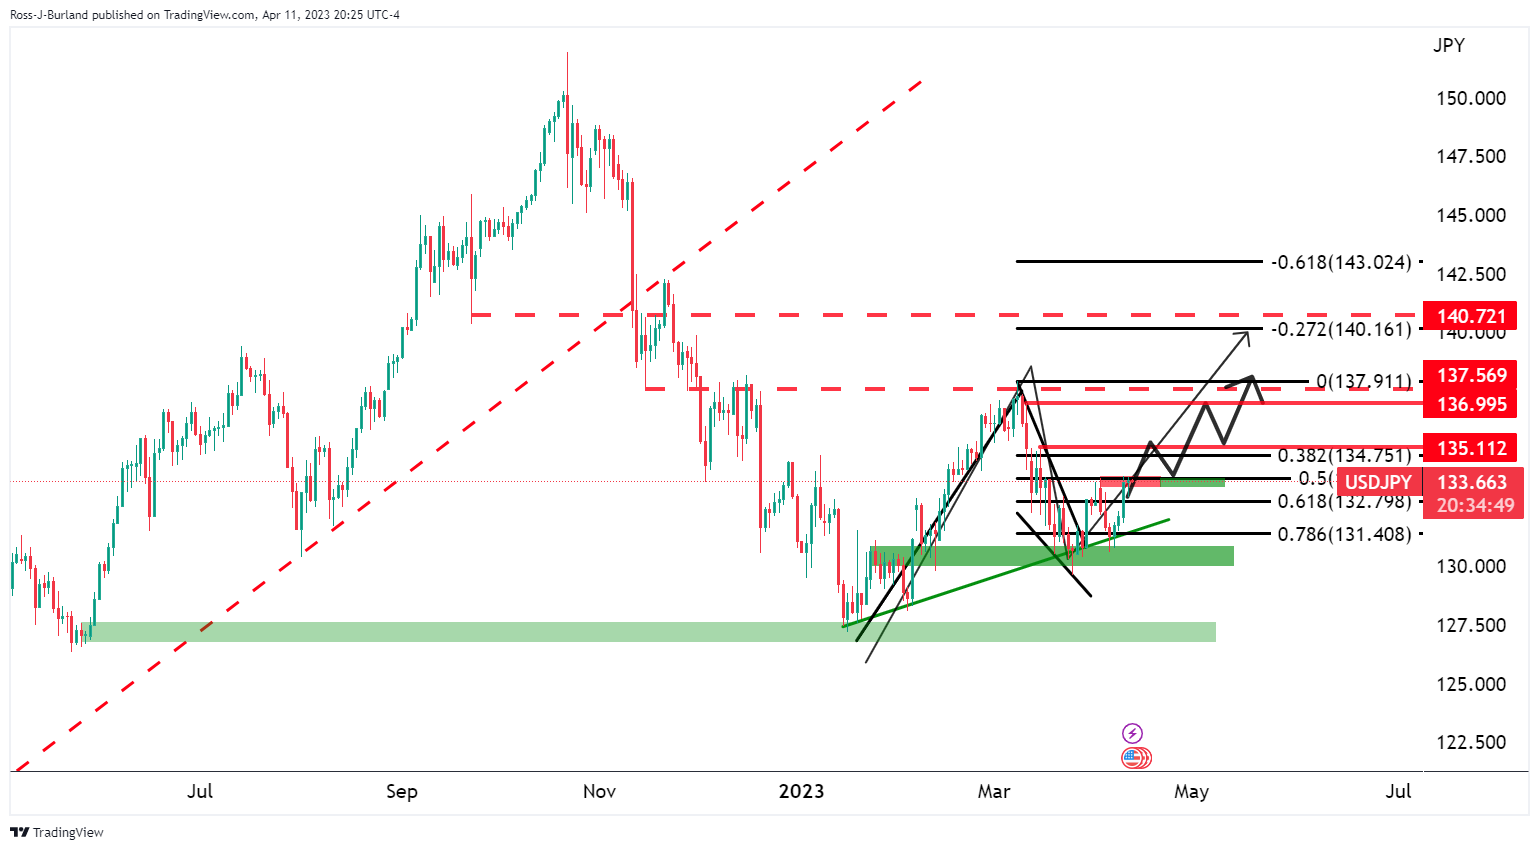
We can see that the price is trying to break out from the bear channel in what is a rather over-extended bull flag pattern, but nonetheless, the bulls are in control.
The price is testing resistance.
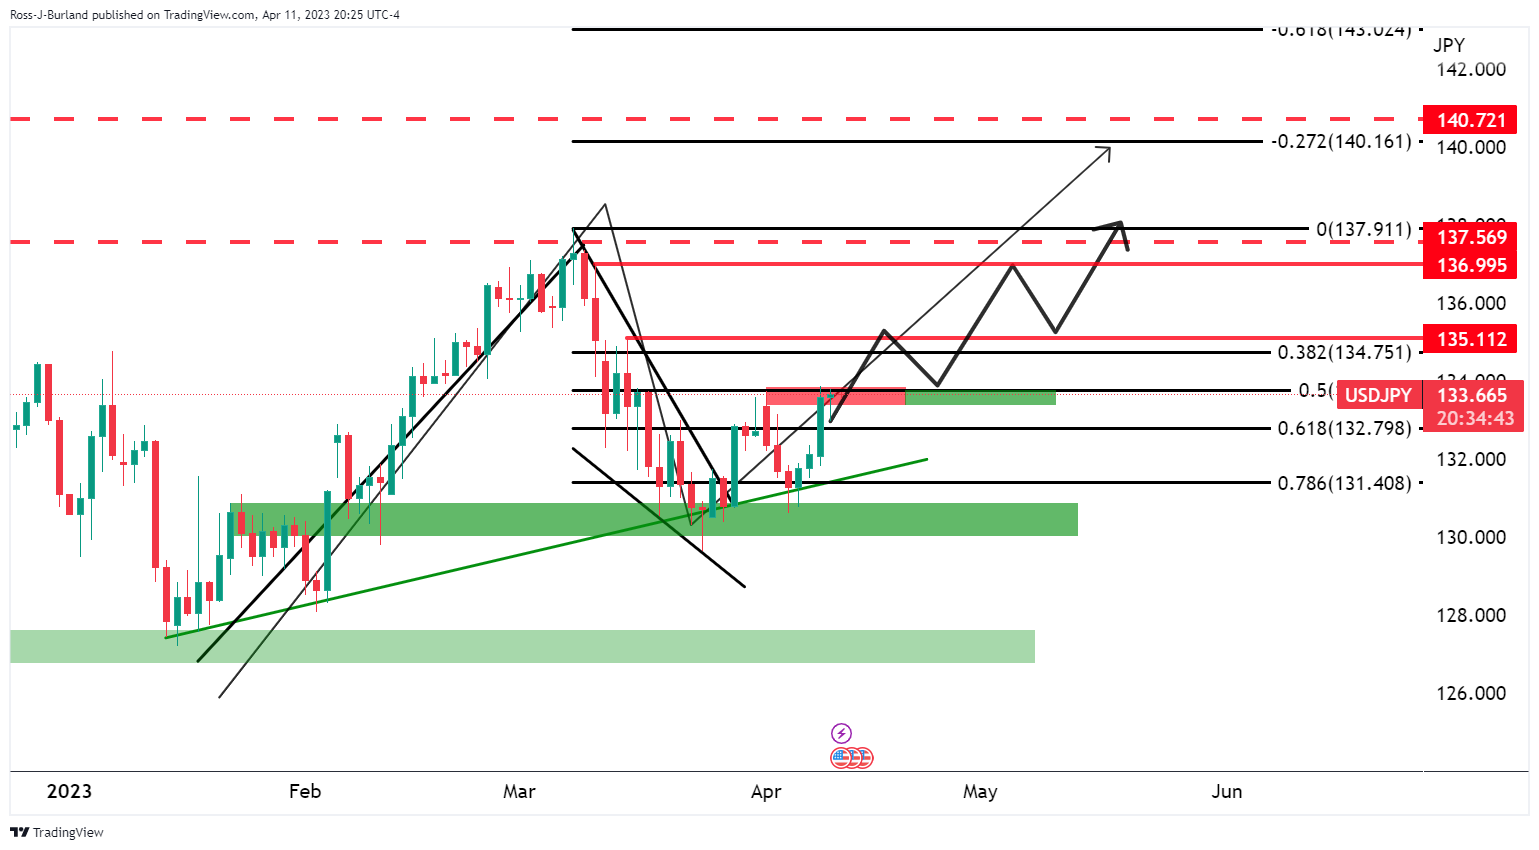
USD/JPY H4 chart
The 4-hour chart shows that the price is supported in a Fibo confluence as well and on the front side of the trend.
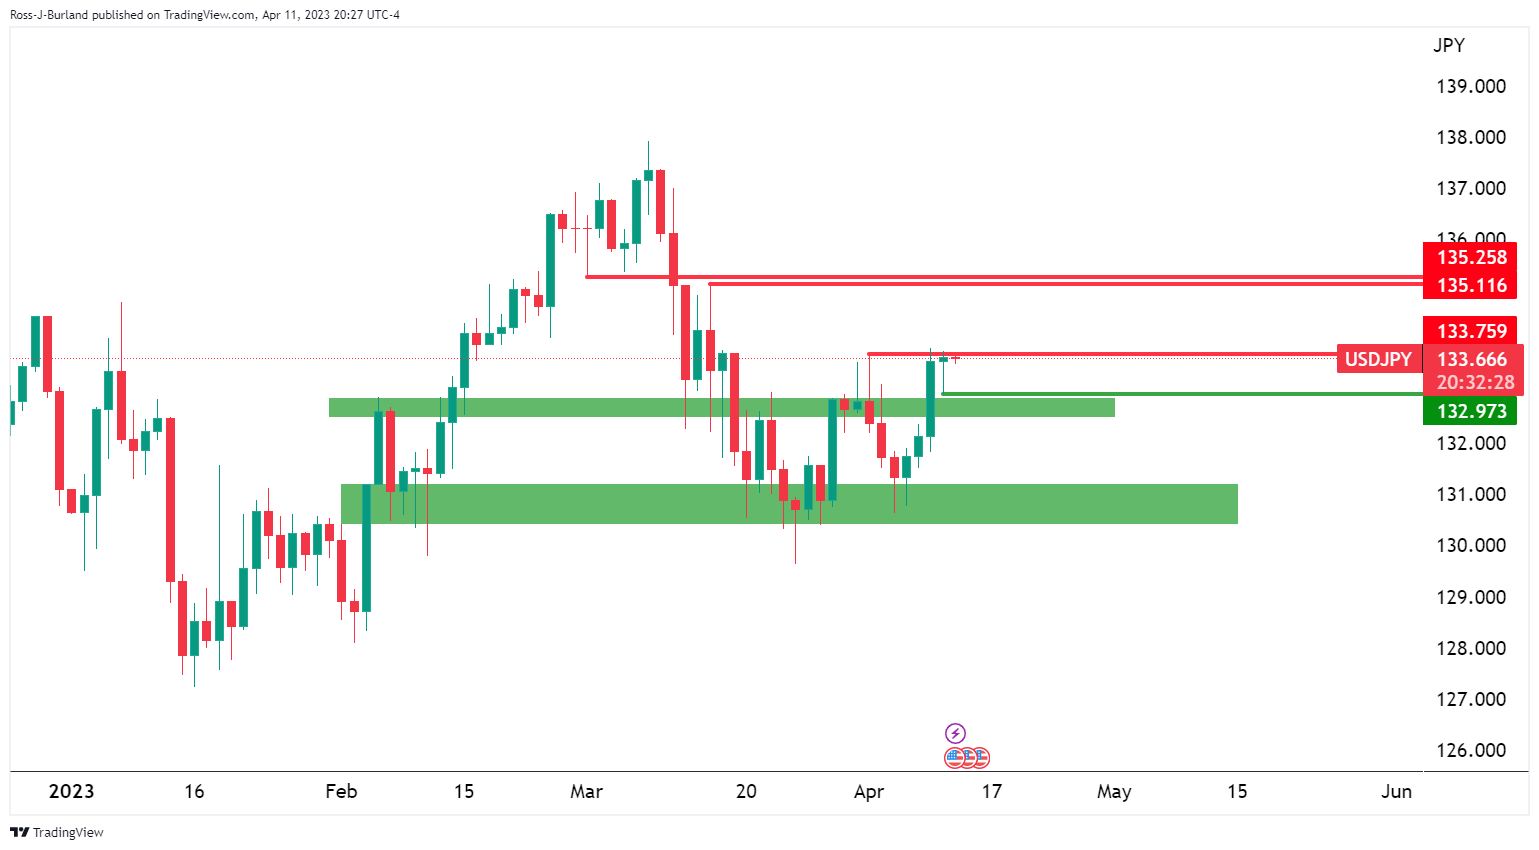
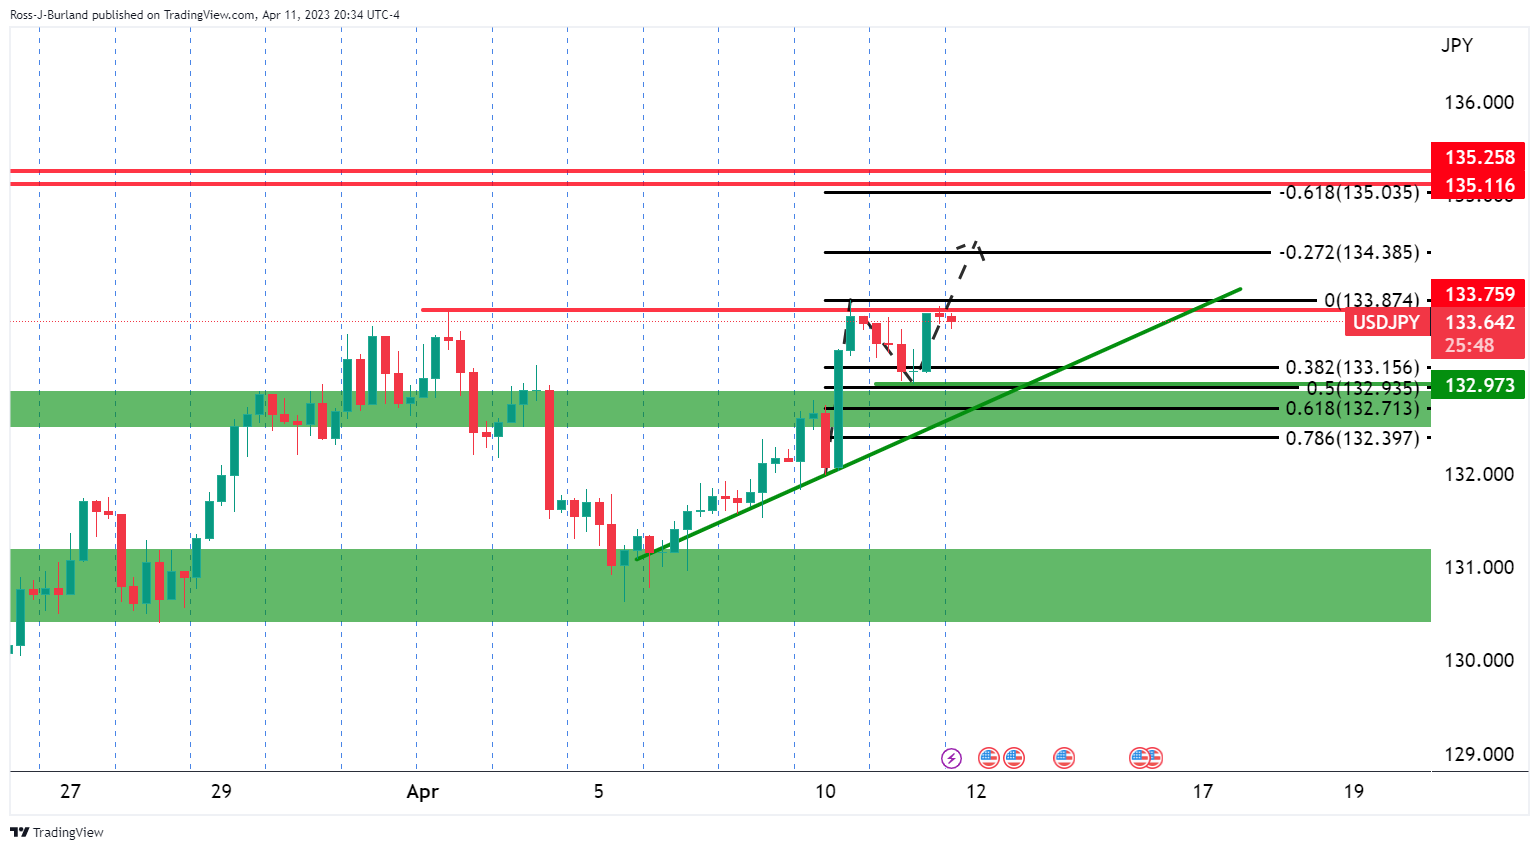
USD/JPY H1 chart
The price is meeting hourly near a 50% mean reversion and rallying from there towards an objective of 134.30-50.
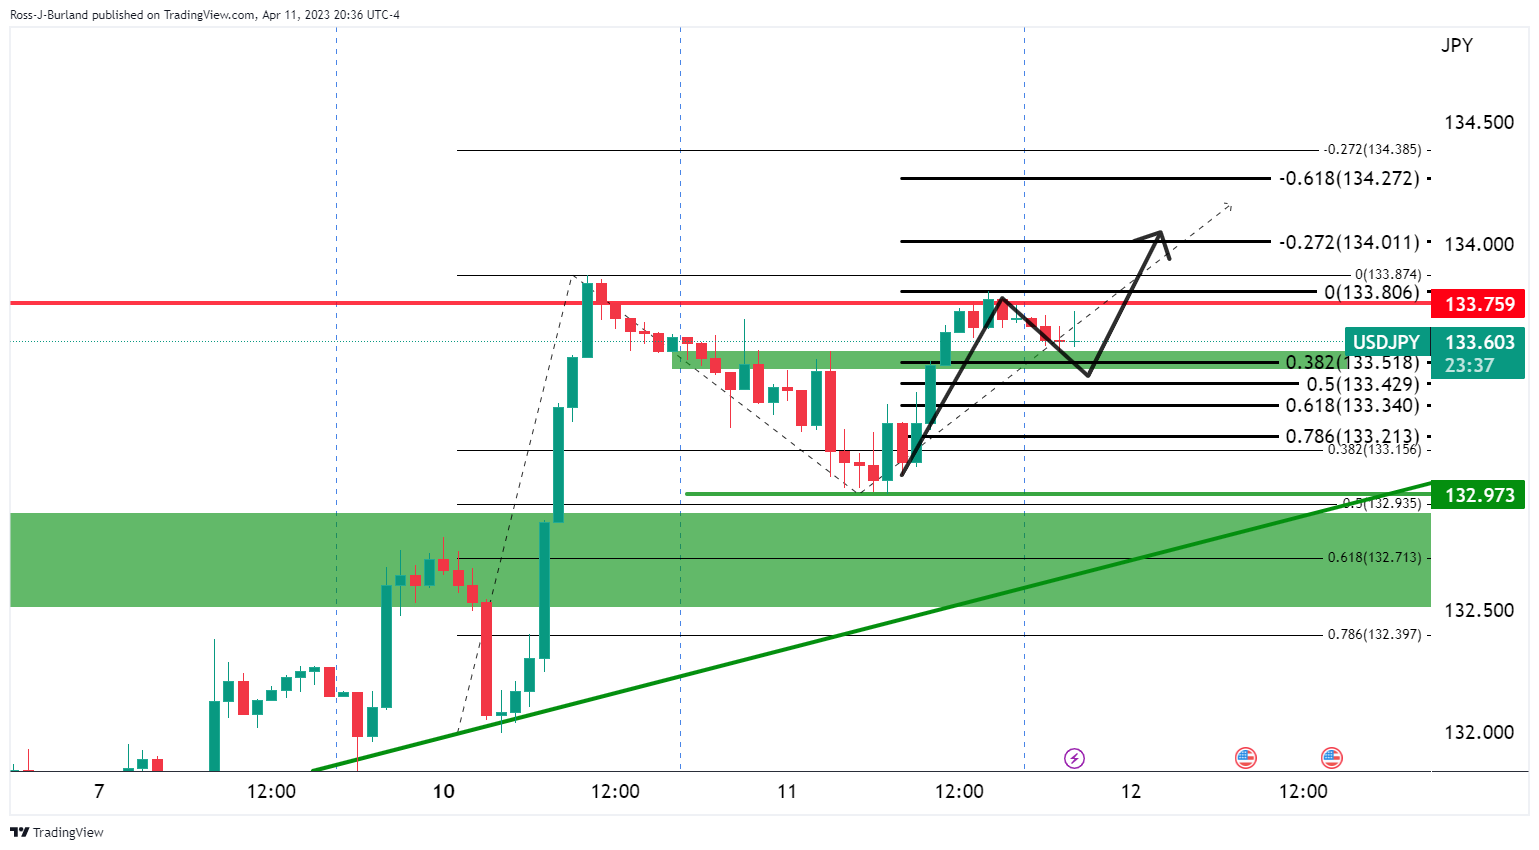
The hourly chart also shows that the price could still correct deeper into support and where there is a 38.2% Fibo of the latest bullish impùlse aligned with the 133.50s, but eyes are on 134.00 for the near-term upside target.