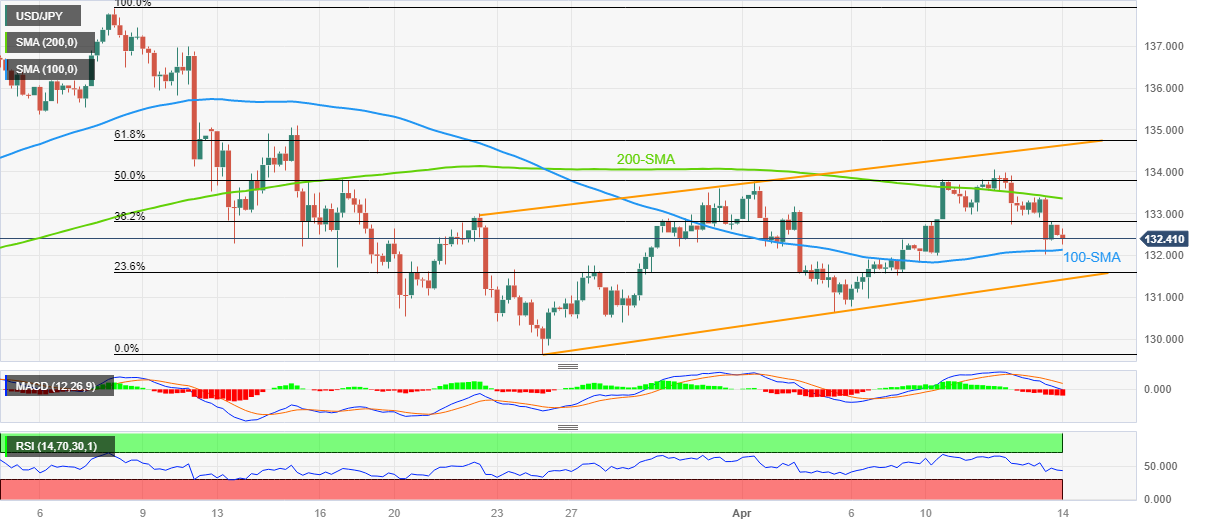
- USD/JPY Price Analysis: Retreats towards 100-SMA support above 132.00
Market news
USD/JPY Price Analysis: Retreats towards 100-SMA support above 132.00
- USD/JPY prints three-day downtrend, fades the previous day’s corrective bounce off weekly low.
- Three-week-old ascending trend channel keeps the Yen pair buyers hopeful beyond 131.40.
- Bearish oscillators, repeated pullbacks from 200-SMA favor sellers.
USD/JPY holds lower ground near 132.40 as it drops for the third consecutive day during early Friday, reversing late Thursday’s corrective bounce.
That said, the quote’s failure to extend the previous day’s rebound beyond the 38.2% Fibonacci retracement level of USD/JPY’s fall during March seems to tease the pair sellers. Adding strength to the downside bias are the bearish MACD signals and downbeat RSI (14), not oversold.
With this, the USD/JPY is well-set to retest the 100-SMA support of around 132.15. However, the quote’s further weakness appears limited at a three-week-long bullish trend channel that could challenge the Yean pair bears around 131.40.
Should the quote breaks the 131.40 support, the monthly low near 130.60 and the 130.00 psychological magnet can check the USD/JPY sellers before directing them to the yearly low of 129.65 marked in March.
On the flip side, the 38.2% Fibonacci retracement level of 132.85 guards the quote’s immediate upside ahead of the 200-SMA hurdle of 133.35.
Though, the 50% Fibonacci retracement and the aforementioned channel’s top line, respectively near 133.85 and 134.60, can challenge the USD/JPY buyers afterward.
Also acting as an upside filter is the 61.8% Fibonacci retracement of around 134.80, also known as the golden Fibonacci ratio, as well as tops marked during March 10-15, close to 135.10-15.
USD/JPY: Four-hour chart

Trend: Limited downside expected