- USD/JPY Price Analysis: Bulls move in ahead of a 38.2% correction
Market news
USD/JPY Price Analysis: Bulls move in ahead of a 38.2% correction
- USD/JPY bulls are moving in again as the US Dollar perks up.
- A geometrical H1 chart pattern is starting to form.
As per the prior analysis, USD/JPY Price Analysis: Bears move into the in-the-money longs, front side of bull trend, whereby the price had been drifting toward a 38.2% Fibonacci retracement of the prior bullish impulse. The bulls are making a move that could start to dissolve the downside corrective extension bias as the following will illustrate,
USD/JPY H4 chart
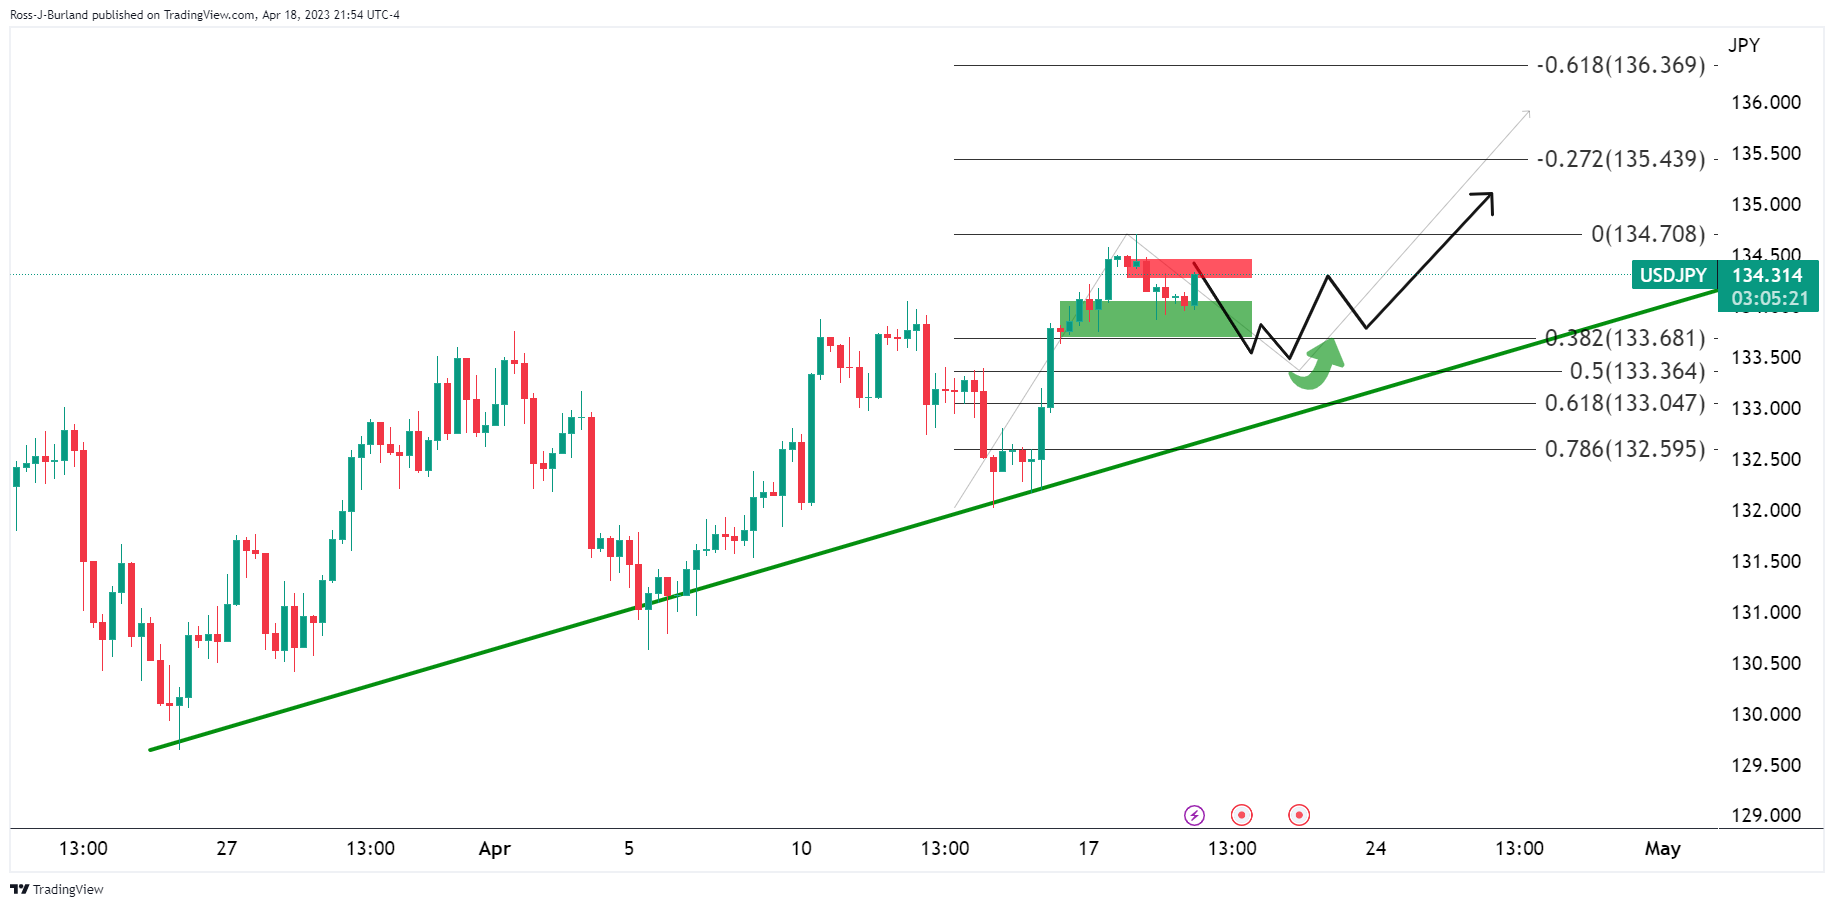
USD/JPY is holding onto the 134 area and bulls are moving in, testing resistance in what could otherwise be a correction underway aiming for the trendline support and lower territory in the 133s.
USD/JPY H1 chart
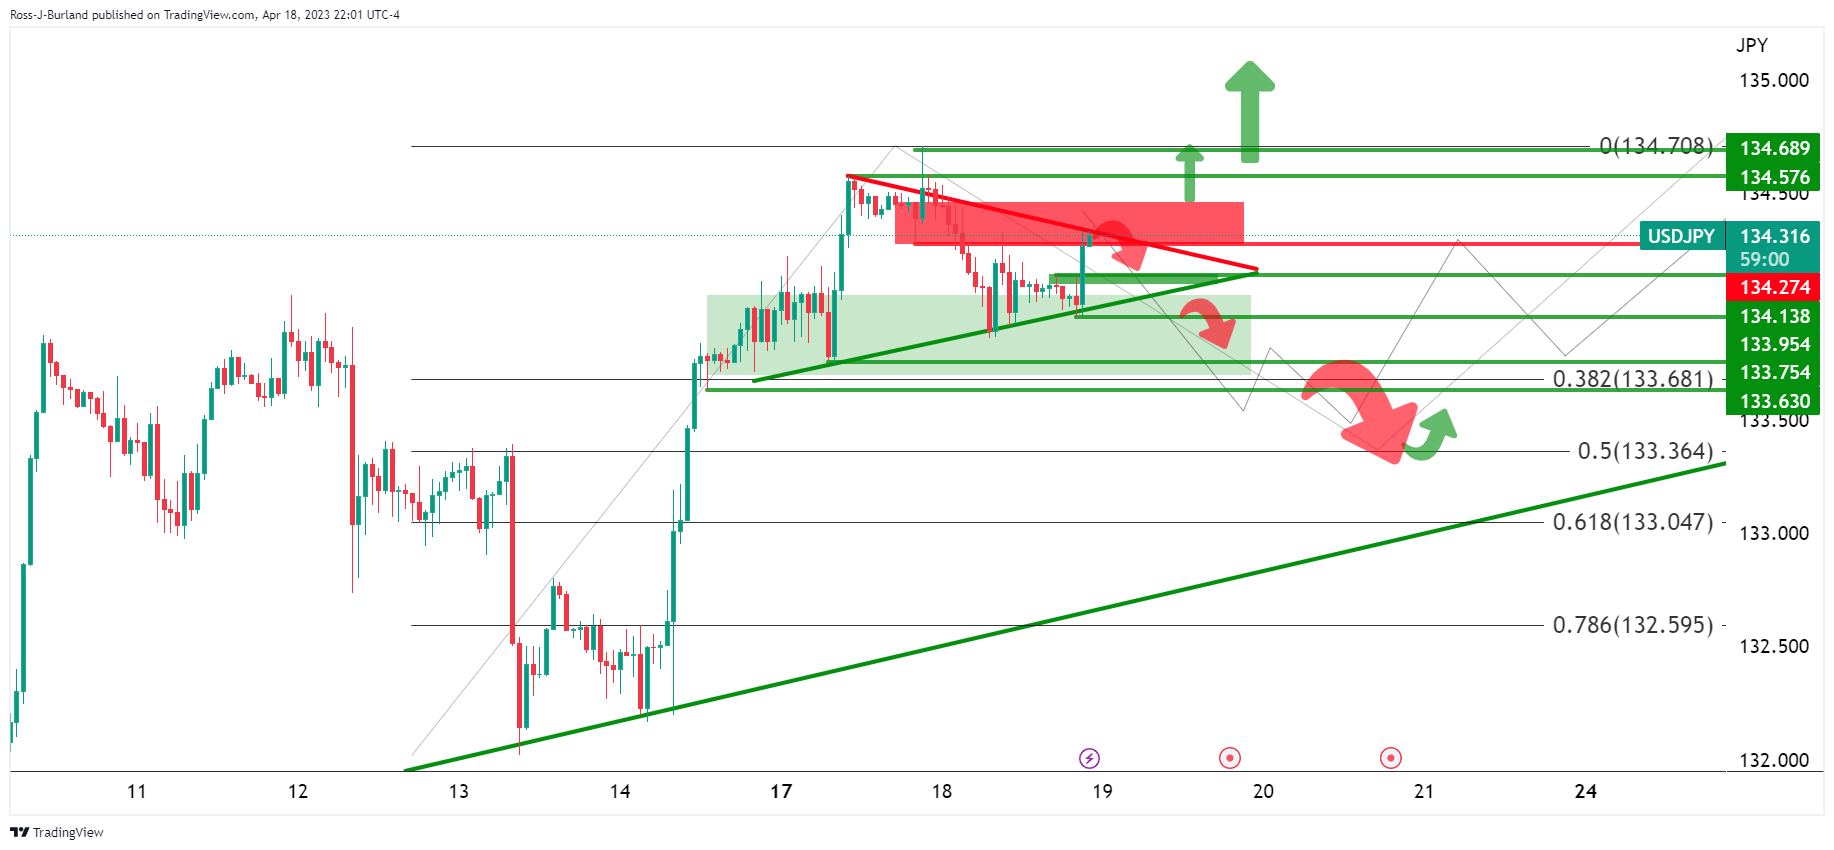
However, the triangle is forming and the coil could see a break out on either side of the geometrical pattern. The 134.50s are key on the upside when the 133.75s guard risk of a deeper correction below a 38.2% Fibonacci retracement. Either way, the bias is bullish while on the front side of the bullish trendline.