- Gold Price Forecast: XAU/USD rebound appears elusive below $2,010 – Confluence Detector
Market news
Gold Price Forecast: XAU/USD rebound appears elusive below $2,010 – Confluence Detector
- Gold price portrays bearish consolidation ahead of the key US data/events.
- Recession woes, higher Fed bets keep XAU/USD bears hopeful amid repeated failures to cross $2,010 key hurdle.
- US PMIs, last round of Fed talks ahead of May FOMC eyed for clear directions of the Gold price.
Gold price (XAU/USD) portrays a corrective rebound ahead of the key US data/events while paring the losses marked in the last two weeks. Even so, the bright metal stays within a one-month-old bullish channel, currently between $1,970 and $2,050, as traders remain cautious before the all-important May Federal Open Market Committee (FOMC) Monetary policy meeting. Even so, the XAU/USD sellers remain hopeful as the major central bankers’ “higher for longer” slogan joins recession woes below the $2,010 key resistance.
That said, the looming fears of economic recession, backed by hawkish signals from the major central banks, seem to weigh on the Gold price despite the latest corrective bounce off the aforementioned channel’s lower line. Adding strength to the rebound is the recent pullback in the yields and the US Dollar amid hopes of China’s sustained economic recovery. It’s worth noting that the incoming figures of the US preliminary PMIs for April and the last round of the Fed policymakers’ speeches before the May FOMC needs to defend the hawkish Fed bets to keep the Gold price down for the second consecutive week.
Also read: Gold Price Forecast: XAU/USD bears eye acceptance below 21 DMA after bearish wedge confirmation
Gold Price: Key levels to watch
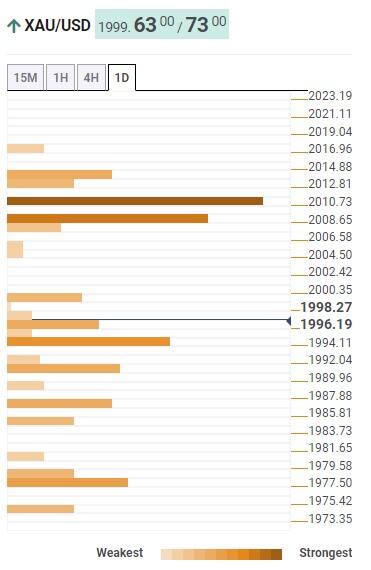
Our Technical Confluence Indicator shows that the Gold price grinds higher towards the $2,010 resistance confluence comprising the previous monthly high and Fibonacci 61.8% on one-week. Ahead of that, a convergence of the 10-DMA and 5-DMA prods the XAU/USD bulls around $2,008.
It’s worth noting that the Gold price upside past $2,010 has a minor bump around $2,015, encompassing Pivot Point one-day R1, which can prod the XAU/USD bulls before directing them to the $2,050 resistance that includes the top line of a one-month-old bullish channel.
On the contrary, Fibonacci 61.8% on one-day and the middle band of the Bollinger on one-day together highlight $1,995 as immediate support for the Gold traders to watch during the quote’s fresh downside.
Following that, the previous weekly low of around $1,985 and the Pivot Point one-week S1 around $1,977 could act as the last defenses of the XAU/USD buyers.
Overall, the Gold price remains on the bear’s radar unless breaking $2,010.
Here is how it looks on the tool
About Technical Confluences Detector
The TCD (Technical Confluences Detector) is a tool to locate and point out those price levels where there is a congestion of indicators, moving averages, Fibonacci levels, Pivot Points, etc. If you are a short-term trader, you will find entry points for counter-trend strategies and hunt a few points at a time. If you are a medium-to-long-term trader, this tool will allow you to know in advance the price levels where a medium-to-long-term trend may stop and rest, where to unwind positions, or where to increase your position size.