- Gold Price Forecast: XAU/USD surges beyond $2,000 spurred by weak USD on poor jobs data
Market news
Gold Price Forecast: XAU/USD surges beyond $2,000 spurred by weak USD on poor jobs data
- US Initial Jobless Claims disappoint a prelude that the labor market is easing.
- The latest Federal Reserve Beige Book shows the US economy is slowing down, led by inflation, hiring, and consumption.
- Gold Price Analysis: To remain sideways within the $1,98-$2,015 range.
Gold price climbs and reclaims the $2,000 after traveling towards weekly lows on Wednesday at $1,969.34, though economic data from the United States (US) bolstered the yellow-metal. In addition, US bond yields are falling, weakening the US Dollar (USD). At the time of typing, the XAU/USD is trading at $2,006.91, above its opening price by 0.61%.
US economic data hurt the US Dollar, boost Gold higher
Risk aversion is the game’s name, even though the CBOE Volatility Index (VIX) remains below 17.00. Wall Street remains pressured after the US Bureau of Labor Statistics (BLS) revealed that unemployment claims rose. Initial Jobless Claims for the latest week rose by 245K, exceeded estimates of 240K, and weighed on US bond yields, a tailwind for Gold.
The XAU/USD was underpinned by a worse-than-expected Philadelphia Fed Manufacturing Index report, which collapsed to -31.3, down from March -23.2, a headwind for the greenback, as recessionary fears reignited following the announcement.
Furthermore, the Beige Book revealed on Wednesday that the US economy is decelerating as hiring and inflation are slowing. The book noted that access to credit is narrowing, wages are increasing, and consumer spending is contracting.
Despite the above, the CME FedWatch Tool still displays that the swaps markets expect a 25 bps hike at the May meeting, with odds at 88.6%.
Consequently, the US 2-year Treasury bond yield tumbles eight bps, down at 4.161%, while the 10-year benchmark note rate clings to the 3.538% area, down five bps. The US 10-year TIPS bond yield, a proxy for real yields, which influences XAU/USD prices, caps the advance of Gold, with gains of 4 bps, up at 1.264%.
The US Dollar Index, a measure of the buck’s value vs. a basket of six currencies, is down 0.20%, at 101.739.
What to watch?
Ahead into the week, US Federal Reserve officials will cross newswires, with six Fed policymakers speaking on Thursday, followed by Lisa C’ok’s on Friday, ahead of the media blackout. Data-wise, the US agenda on Friday, will reveal S&P Global PMIs on its final reading for April
Gold Technical Analysis
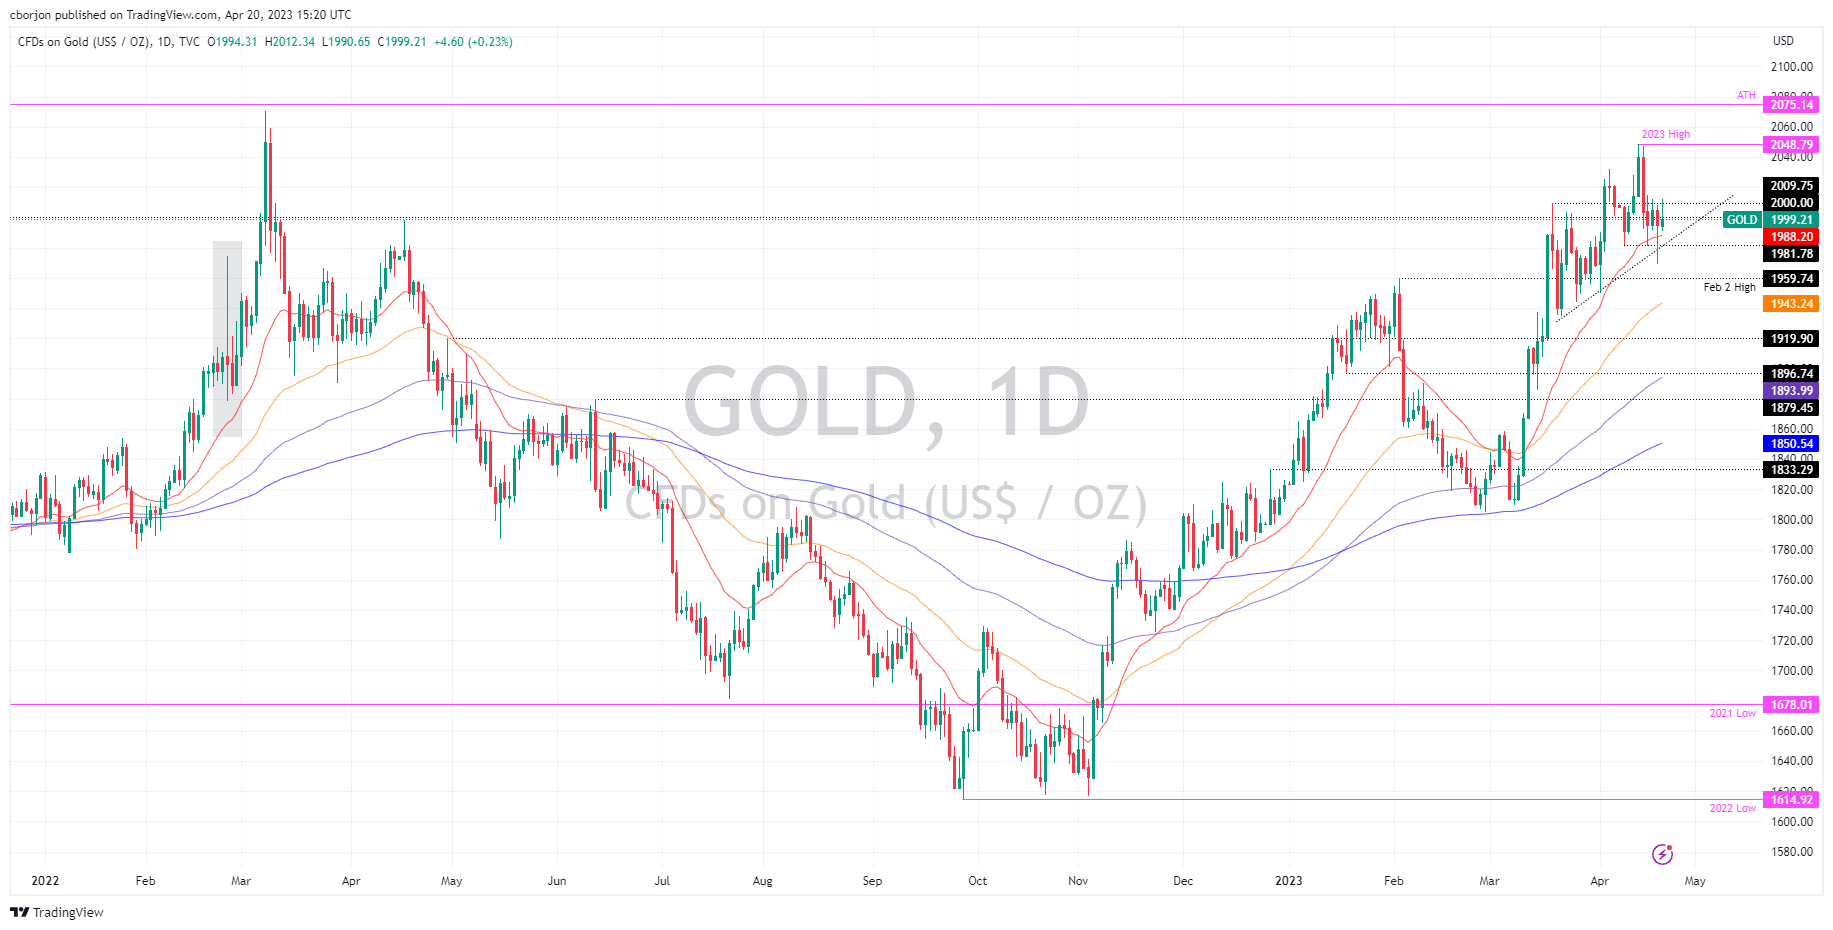
After dipping below the 20-day Exponential Moving Average (EMA) at $1,988.60, the XAU/USD resumed its uptrend, though downside risks remain. Of note, after peaking at $2,048.79, XAU/USD’s tumbled, and since April 17, the Gold price remains trading within the $1,980-$2,015 range, unable to decisively break below/above the boundaries of that area, meaning a daily close is pending below $1,980 or above $2,015. On the downside, the XAU/USD’s road is busy with immediate resistance with the $2,000 psychological level, followed by the 20-day EMA, and then the weekly low of $1,969.34. Conversely, the XAU/USD will meet resistance at $2,015, which, once cleared, it could pave the way toward the YTD high at $2,048.79.