- USD/INR Price Analysis: Remains confined in a narrow trading band, holds above 82.00 mark
Market news
USD/INR Price Analysis: Remains confined in a narrow trading band, holds above 82.00 mark
- USD/INR is seen oscillating in a narrow trading band above the 82.00 round figure.
- Neutral technical indicators on the daily chart hold back traders from placing bets.
- Any meaningful slide could be seen as a buying opportunity near the 200-day SMA.
The USD/INR pair struggles to gain any meaningful traction on Friday and oscillates in a narrow trading band above the 82.00 mark heading into the European session.
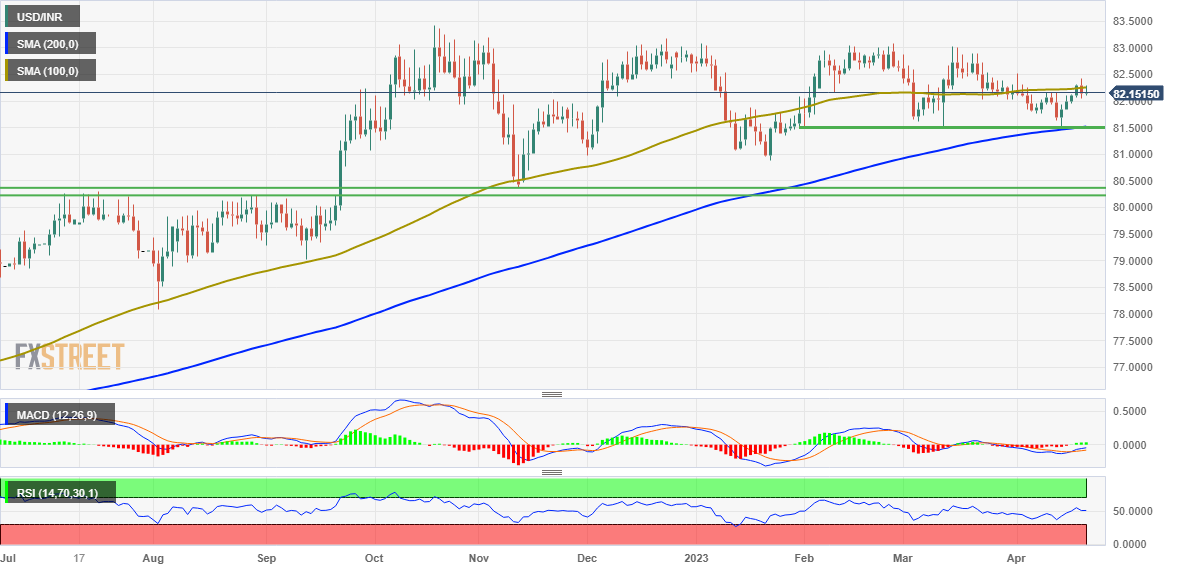
From a technical perspective, neutral oscillators on the daily chart haven't been supportive of any firm near-term direction. This, in turn, holds back traders from placing aggressive bets and leads to subdued price action on the last day of the week. The USD/INR pair, however, has managed to hold its neck above the 81.50 horizontal support. The said area now coincides with the very important 200-day Simple Moving Average (SMA) and should act as a pivotal point.
A convincing breakdown through the aforementioned support will be seen as a fresh trigger for bearish traders and pave the way for deeper losses. The USD/INR might then accelerate the fall towards testing the 81.00 round-figure mark. The downward trajectory could get extended further towards the next relevant support near the 81.40-81.30 region, which if broken decisively will confirm that spot prices have topped out and set the stage for a further depreciating move.
On the flip side, the monthly swing high, around the 82.50 level, might now act as an immediate hurdle, above which a bout of a short-covering move should allow the USD/INR pair to make a fresh attempt to conquer the 83.00 mark. Some follow-through buying beyond the 83.20-83.30 supply zone, or the all-time peak, will mark a fresh bullish breakout and prompt aggressive technical buying, paving the way for a move towards reclaiming the 84.00 round-figure mark.
USD/INR daily chart
Key levels to watch