- USD/CAD Price Analysis: Breaks through 50-day EMA resistance, reclaims 1.3600
Market news
USD/CAD Price Analysis: Breaks through 50-day EMA resistance, reclaims 1.3600
- The USD/CAD is ready to test a one-month-old resistance trendline at around 1.3650.
- USD/CAD Price Analysis: Upward biased, it could test the 1.3700 figure.
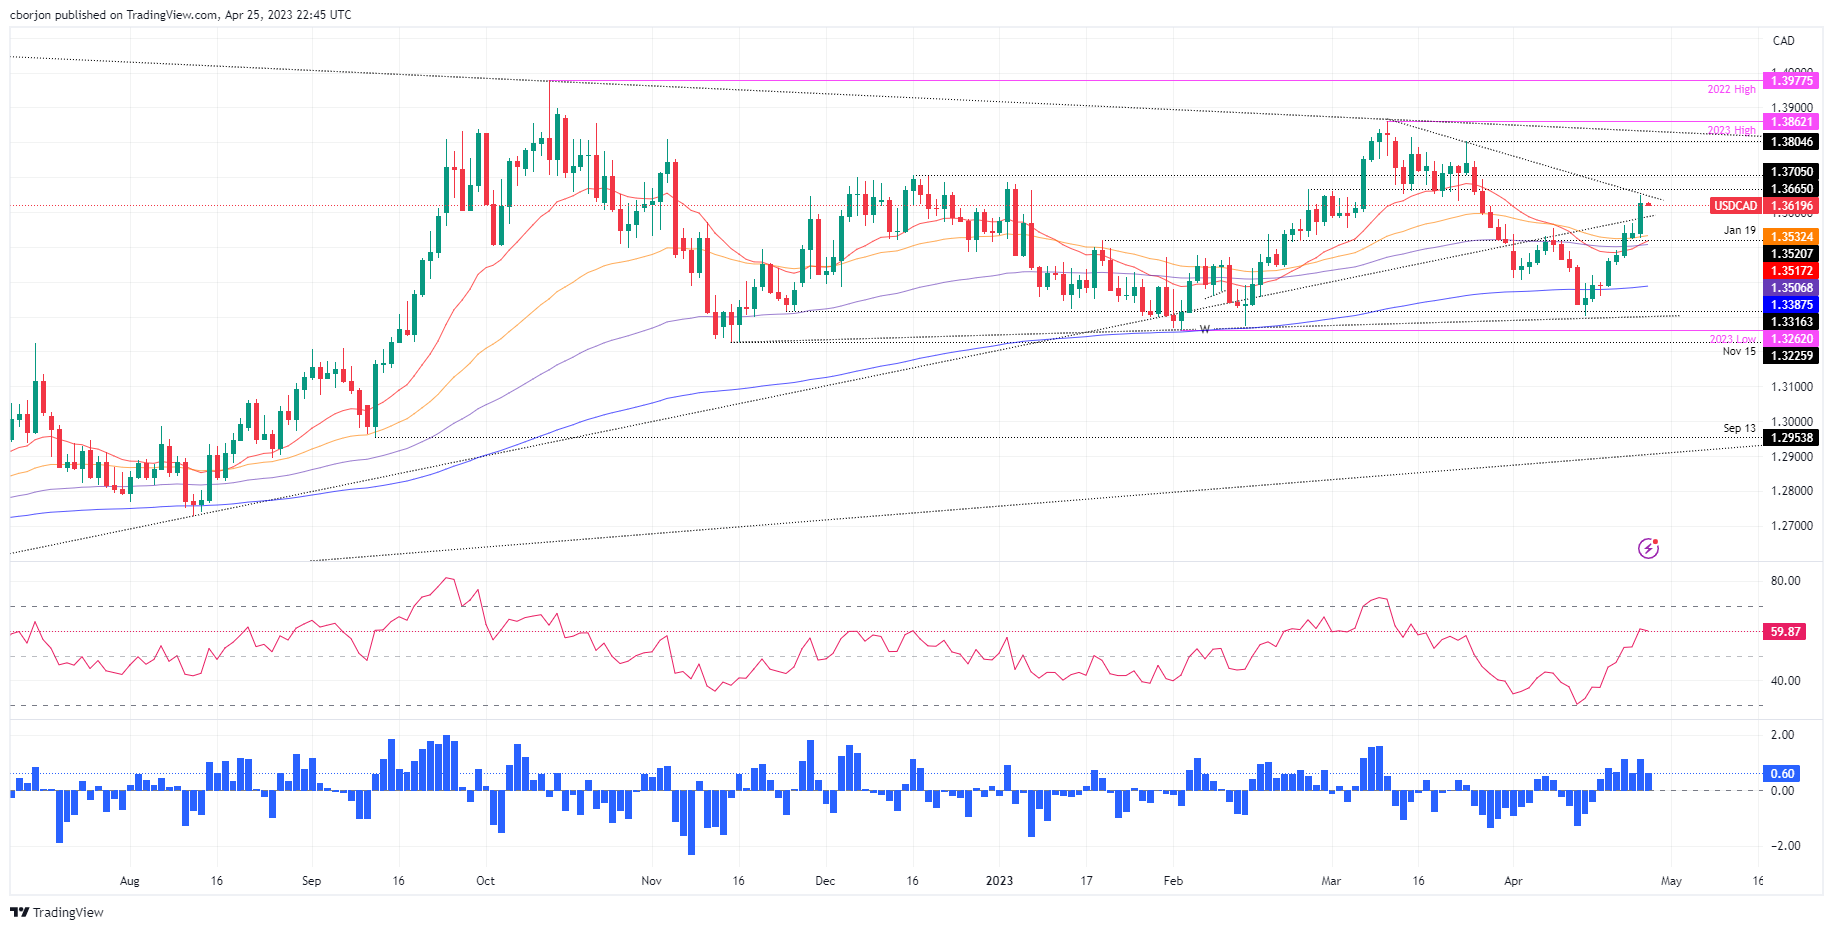
The USD/CAD reclaims the 1.3600 mark after dropping to a daily low of 1.3524. The pair tested the 50-day Exponential Moving Average (EMA) at 1.3532 before reversing its course and posting gains of 0.64% on Tuesday. As the Asian session begins, the USD/CAD exchanges hands at around 1.3620.
USD/CAD Price Analysis
After Tuesday’s price action, the USD/CAD is poised to test a resistance trendline at around 1.3635-50, which could pave the way for further upside once broken. In addition, the Relative Strength Index (RSI), in bullish territory, aims upward, suggesting buyers are moving in. Another reason for the USD/CAD to continue its uptrend is the Rate of Change (RoC), indicating that buying pressure increased in the last three days.
That said, the USD/CAD first resistance would be 1.3650. Once cleared, the USD/CAD next resistance would be 1.3700, followed by the March 24 cycle high at 1.3804 and the YTD high at 1.3862.
Conversely, the USD/CAD could shift downwards if it fails to crack the one-month-old resistance trendline. Hence, the USD/CAD first support would be the psychological 1.3600 figure. The seller’s next stop would be the 50-day EMA at 1.3532 before testing the 20-day EMA at 1.3517, followed by the 100-day EMA at 1.3506.
USD/CAD Daily Chart