- AUD/USD Price Analysis: Inch far from 0.6600 as soft Australian CPI cements steady RBA policy
Market news
AUD/USD Price Analysis: Inch far from 0.6600 as soft Australian CPI cements steady RBA policy
- AUD/USD has dropped sharply to near 0.6600 as Australian inflation softens further.
- Soft Australian inflation would support the RBA to stay with the decision of keeping interest rates unchanged.
- The USD Index is eying an upside break of the consolidation formed in a narrow range above 101.80.
The AUD/USD pair is continuously declining towards the round-level support of 0.6600 after the Australian Bureau of Statistics reported further softening of inflation data. The quarterly Consumer Price Index (CPI) (Q1) accelerated by 1.4% but was lower than the former pace of 1.9%. Annual inflation has softened to 7.0%, a little higher than the estimates of 6.9% but lower than the prior release of 7.8%.
The monthly CPI indicator decelerated to 6.1% from the consensus of 6.6% and the previous release of 6.8%. A significant deceleration in Australian inflation is going to support the Reserve Bank of Australia (RBA) to stay with the decision of keeping interest rates unchanged at 3.60%, as announced in April’s monetary policy meeting.
Meanwhile, the US Dollar Index (DXY) is eying an upside break of the consolidation formed in a narrow range above 101.80. S&P500 futures have added significant gains despite a bearish Tuesday, portraying a recovery in the risk appetite of the market participants.
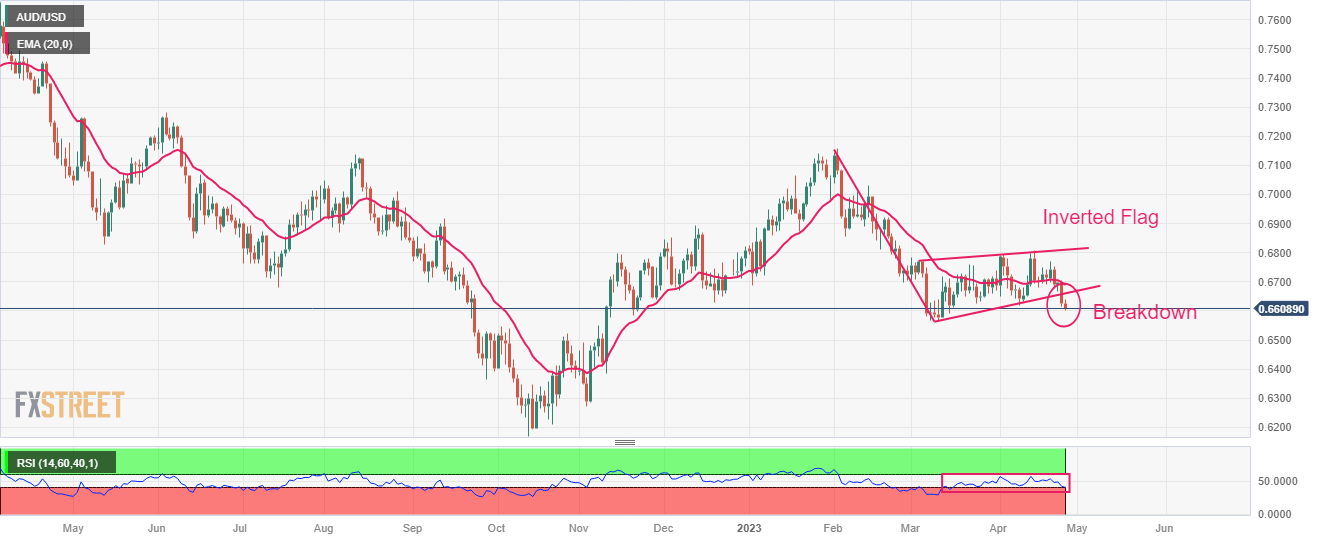
AUD/USD has delivered a breakdown of the Inverted Flag chart pattern formed on a daily scale. The aforementioned chart pattern is a trend continuation pattern in which a long consolidation is followed by a breakdown. Usually, the consolidation phase of the chart pattern serves as an inventory adjustment in which those participants initiate shorts, which prefer to enter an auction after the establishment of a bearish bias and current sellers add more positions.
Going forward, the 20-period Exponential Moving Average (EMA) around 0.6700 will act as a barricade for the Aussie bulls.
Adding to that, a slippage into the bearish range of 20.00-40.00 by the Relative Strength Index (RSI) (14) will trigger a downside momentum.
US Dollar bulls will flex their muscles if the Aussie asset will drop below March 15 low at 0.6590. An occurrence of the same will expose the asset to March 08 low at 0.6568 followed by 02 November 2022 high around 0.6500.
In an alternate scenario, only a decisive move above the round-level resistance of 0.6800 will drive the asset toward February 23 high at 0.6872 and February 20 high at 0.6920.
AUD/USD daily chart