- WTI is under pressure from rising US Dollar despite a dip in US oil inventories
Market news
WTI is under pressure from rising US Dollar despite a dip in US oil inventories
- WTI bounced as US EIA revealed crude inventories dropped by 5.1 million barrels compared to the last week.
- Gasoline and distillates followed suit, though they did not underpin WTI’s price.
- WTI Price Analysis: Downward pressured by solid resistance around $77.24-$78.37.
Western Texas Intermediate (WTI), the US crude oil benchmark, trims some of its earlier losses that carried oil prices toward its weekly low at $75.69 per barrel. However, a late recovery in the US Dollar (USD) keeps WTI pressured, even though a report on US crude inventories falls more than expected, as data shows. At the time of writing, WTI is trading at $76.42 PB, down 1.21%.
On Wednesday, the US Energy Information Administration (EIA) revealed that crude inventories slid by 5.1 million barrels compared to last week, exceeding estimates of -1.5 million. The EIA informed that gasoline and distillates also declined by 2.4 million barrels and almost 600,000 barrels, respectively.
Following the release of the EIA’s report, WTI bounced off daily lows at around $75.60 PB toward the current price level.
Of note is that WTI prices had almost erased all of their gains after the Organization of the Petroleum Exporting Countries (OPEC) and its allies, known collectively as OPEC+, announced additional cuts to crude oil in early April.
WTI dived on Tuesday on concerns that additional rate hikes by global central banks could dent demand. The latest tranche of US economic data, particularly Federal Reserve’s (Fed) Regional Banks Manufacturing and Business activity indices, flashed an ongoing economic deceleration. Nevertheless, expectations for further tightening remain high, with most investors expecting a 25 bps rate hike by the Fed at the May 2-3 meeting.
Moreover, US consumer confidence deteriorated to a nine-month-low in April, as concerns mounted that the US economy may tip into a recession late in the year.
WTI Technical Analysis
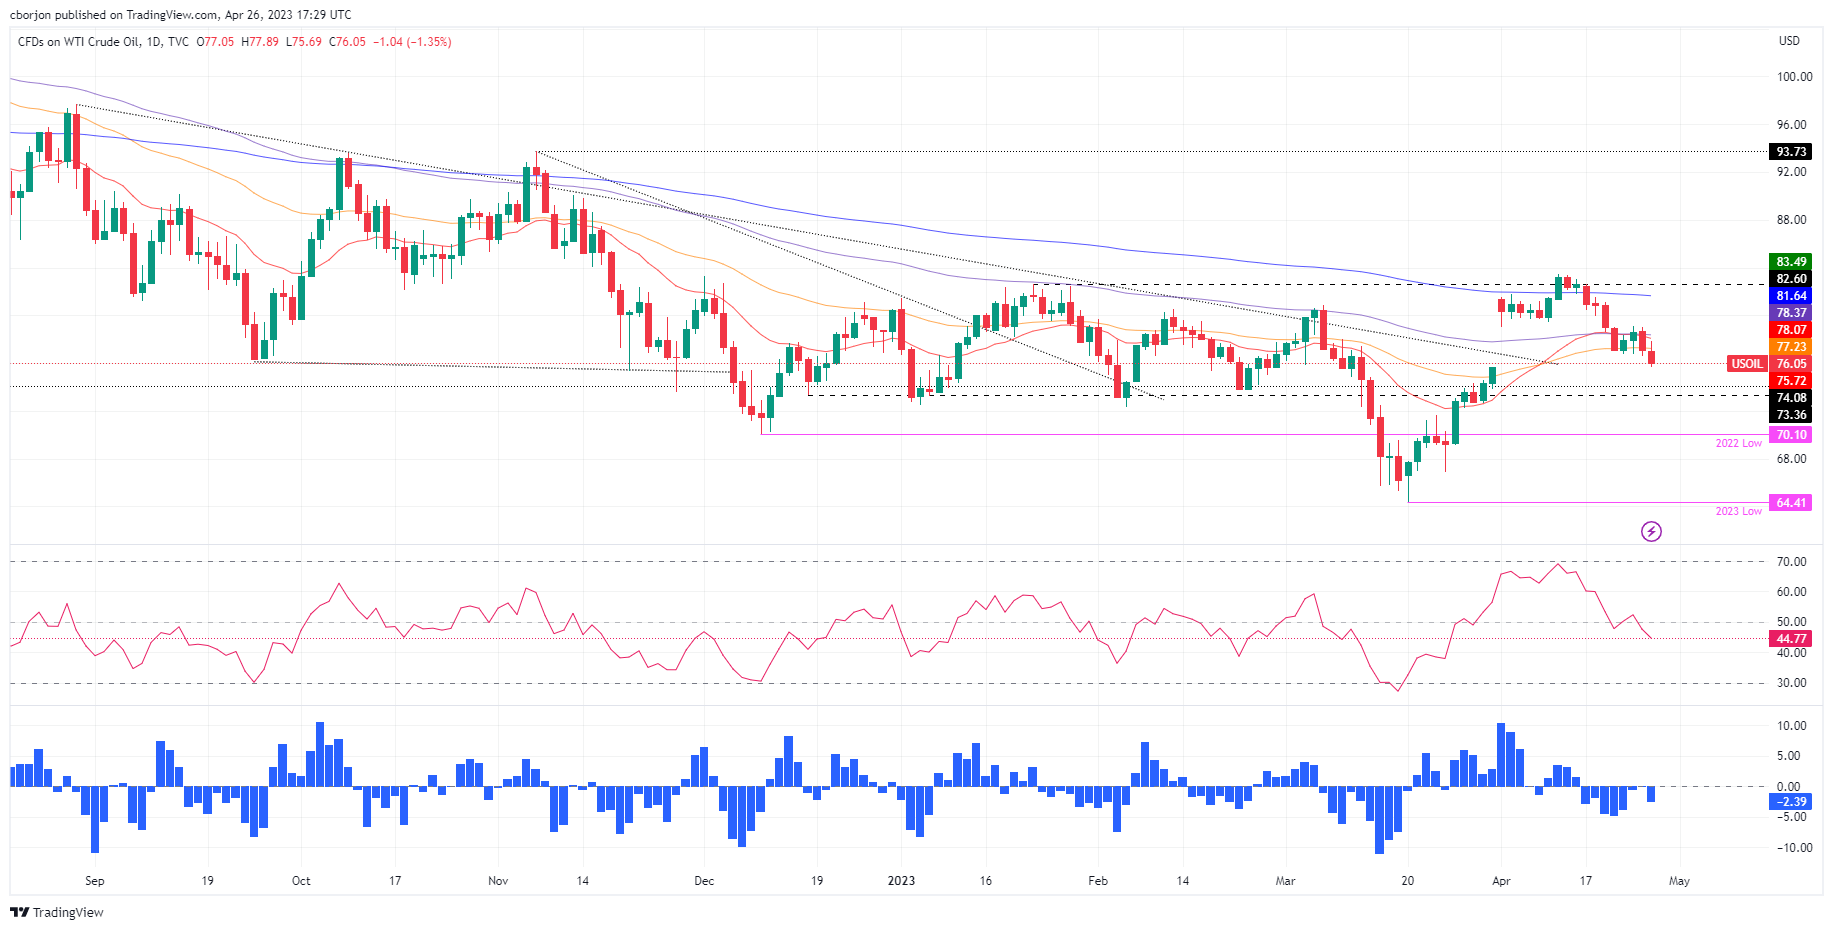
After covering the $6.00 gap, WTI is attempting a recovery towards the $77.00 PB area but faces solid resistance upwards. The 50-day Exponential Moving Average (EMA), at $77.24, would be difficult to surpass, followed by the 20 and 100-day EMAs, at $78.10 and $78.37, respectively. On the flip side, a daily close below the March 31 high of $75.68 could pave the way for a fall toward the $74.00 area.