- Gold Price Forecast: XAU/USD shifts firmly above $2,030 ahead of US debt ceiling talks
Market news
Gold Price Forecast: XAU/USD shifts firmly above $2,030 ahead of US debt ceiling talks
- Gold price has surpassed comfortably above $2,030.00 amid uncertainty over the outcome of US debt ceiling talks.
- The US Dollar Index has rebounded to near 101.64 ahead of the US Inflation data.
- Fed Williams is of the view that the central banks have not said it’s done with raising rates.
Gold price (XAU/USD) has climbed above the $2,030.00 resistance and has shifted its auction above the same in the early Asian session. The upside move in the precious metal is being supported by uncertainty over US debt ceiling talks between US President Joe Biden and some Republican leaders.
S&P500 went through some sell-off on Monday as investors were worried that the absence of any decisive outcome in the debt-ceiling negotiations would impact the outlook of the United States economy, portraying a risk-off mood. The US Dollar Index (DXY) has rebounded to near 101.64 as the downside seems defended ahead of the US inflation data.
At one place where US President Joe Biden was not interested in raising the debt ceiling at the cost of the President’s spending initiatives, Republican House of Representatives Speaker Kevin McCarthy already made clear that he won’t approve debt ceiling raise without cutting President’s spending initiative to safeguard escalating budget deficit.
Meanwhile, hawkish commentary from New York Federal Reserve (Fed) Bank President John Williams has also added to the overall uncertainty in the market. Fed policymakers cited that the central bank needs to be data-dependent with monetary policy and reminded that the Fed will raise rates again if needed. He further added that the Fed has not said it’s done with raising rates and see no reason for rate cuts this year.
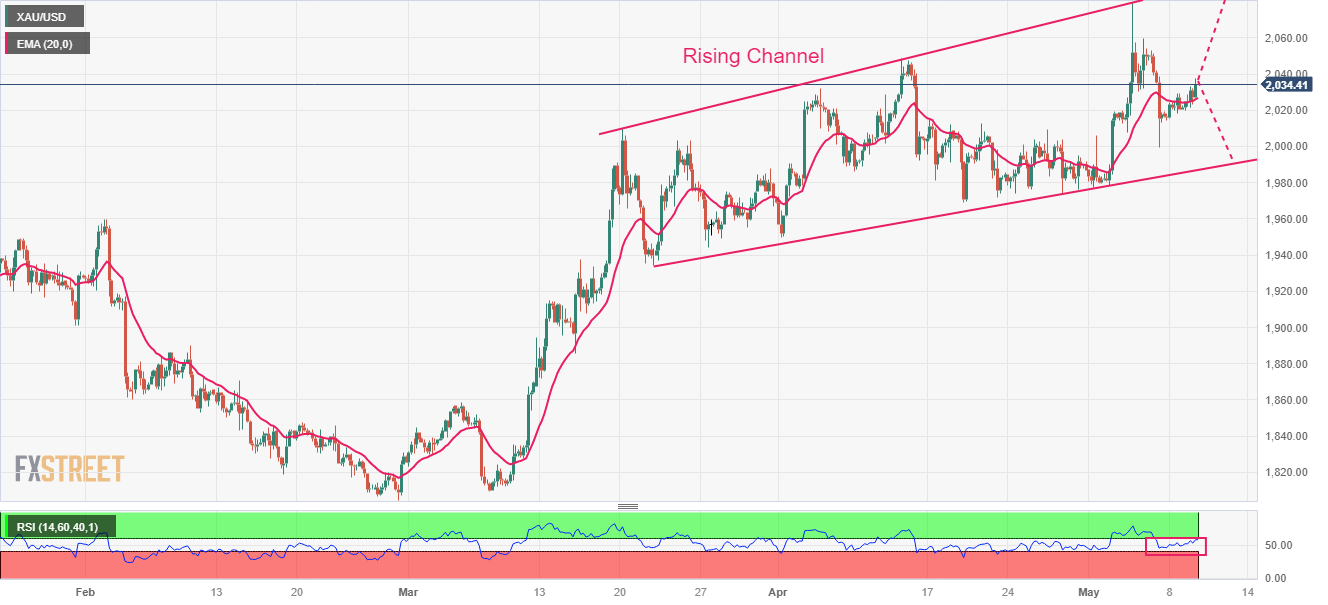
Gold technical analysis
Gold price is auctioning in a Rising Channel chart pattern on a four-hour scale. The upper portion of the aforementioned chart pattern is placed from March 20 high at $2,009.88 while the lower portion is plotted from March 22 low at $1,934.34.
The 20-period Exponential Moving Average (EMA) at $2,027.58 is acting as a cushion for the Gold bulls.
Meanwhile, the Relative Strength Index (RSI) (14) is making efforts for shifting into the bullish range of 60.00-80.00. An occurrence of the same will result in the activation of the upside momentum.
Gold four-hour chart