- Silver Price Analysis: XAG/USD seems vulnerable, bears await break below 38.2% Fibo.
Market news
Silver Price Analysis: XAG/USD seems vulnerable, bears await break below 38.2% Fibo.
- Silver drops to a multi-week low, though finds some support near the 38.2% Fibo. level.
- The technical setup favours bearish traders and supports prospects for deeper losses.
- A sustained strength beyond the $24.20-30 area is needed to negate the negative bias.
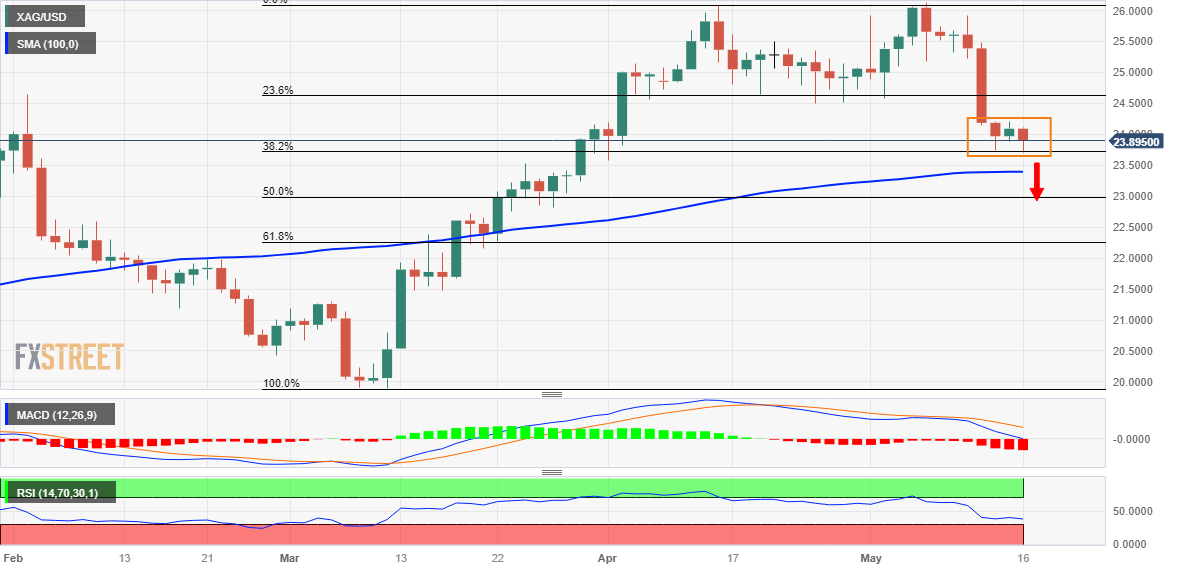
Silver comes under some renewed selling pressure following the previous day's modest uptick and drops to its lowest level since April 3 during the first half of trading on Tuesday. The white metal, however, finds some support near the 38.2% Fibonacci retracement level of the March-May rise and trades just below the $24.00 mark during the early European session, still down 0.80% for the day.
From a technical perspective, the two-way price move witnessed over the past three days constitutes the formation of a rectangle on hourly charts. Against the backdrop of the recent sharp pullback from over a one-year top, this might still be categorized as a bearish consolidation phase. Moreover, oscillators on hourly/daily charts are holding deep in the negative territory and support prospects for further losses.
That said, it will still be prudent to wait for a sustained break below the $23.70-$23.65 area (38.2% Fibo.) before positioning for an extension of over a one-week-old downtrend. The XAG/USD might then test the $23.40 strong horizontal support, which coincides with the 100-day Simple Moving Average (SMA). The latter should act as a pivotal point to determine the near-term trajectory.
The subsequent downfall could drag the XAG/USD towards 50% Fibo. level, around the $23.00 round-figure mark. The next relevant support is pegged near the $22.65-$22.60 region ahead of the $22.30-$22.25 zone, or the 61.8% Fibo. level. A convincing break below the latter will be seen as a fresh trigger for bearish traders and pave the way for a further depreciating move.
On the flip side, the top end of a short-term trading range, around the $24.15-$24.20 region, could act as an immediate hurdle. A sustained strength beyond might trigger a short-covering rally and lift the XAG/USD towards the 23.6% Fibo. level, around the $24.60 zone. Some follow-through buying should allow bulls to reclaim the $25.00 psychological mark and aim to test the next resistance near the $25.30-$25.40 supply zone.
Silver daily chart
Key levels to watch