- GBP/USD Price Analysis: Bears are moving in on the risk rally
Market news
GBP/USD Price Analysis: Bears are moving in on the risk rally
- GBP/USD bulls hit a brick wall in the Wall Street risk rally.
- The daily chart offers a bearish scenario for the days ahead.
GBP/USD is back to flat in the day after initial losses that were sparked in the face of the Bank of England Governor Andrew Bailey reiterating that he expected price pressures to ease, as soon as April. Also, data showed Britain's jobless rate rose to 3.9%, while the rate of increase in total pay held steady. At the time of writing, GBP/USD is trading near 1.2490 and is correcting lower from a 4-hour resistance area.
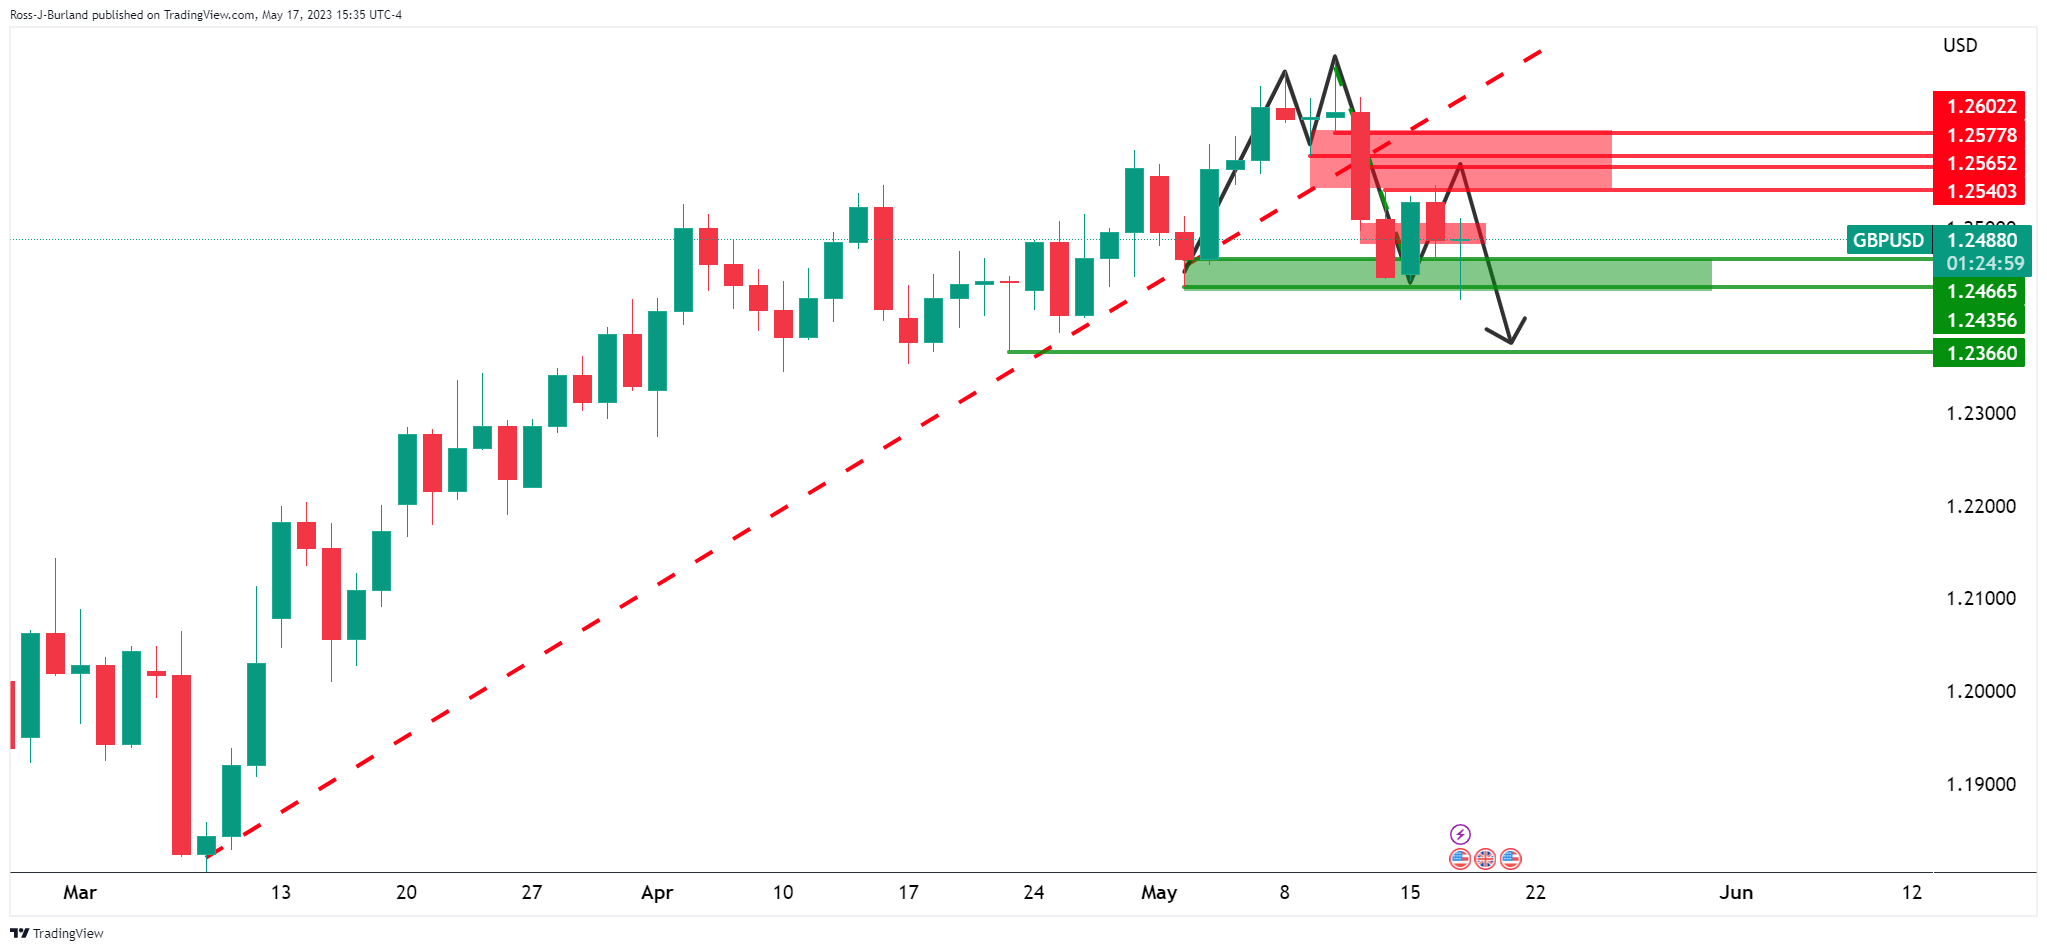
GBP/USD daily chart

The M-formation is a topping pattern that has formed as the potential for the final stage of the prior bullish rally. The price is now on the backside of that trendline, so shorts could be the more favorable playbook for traders:
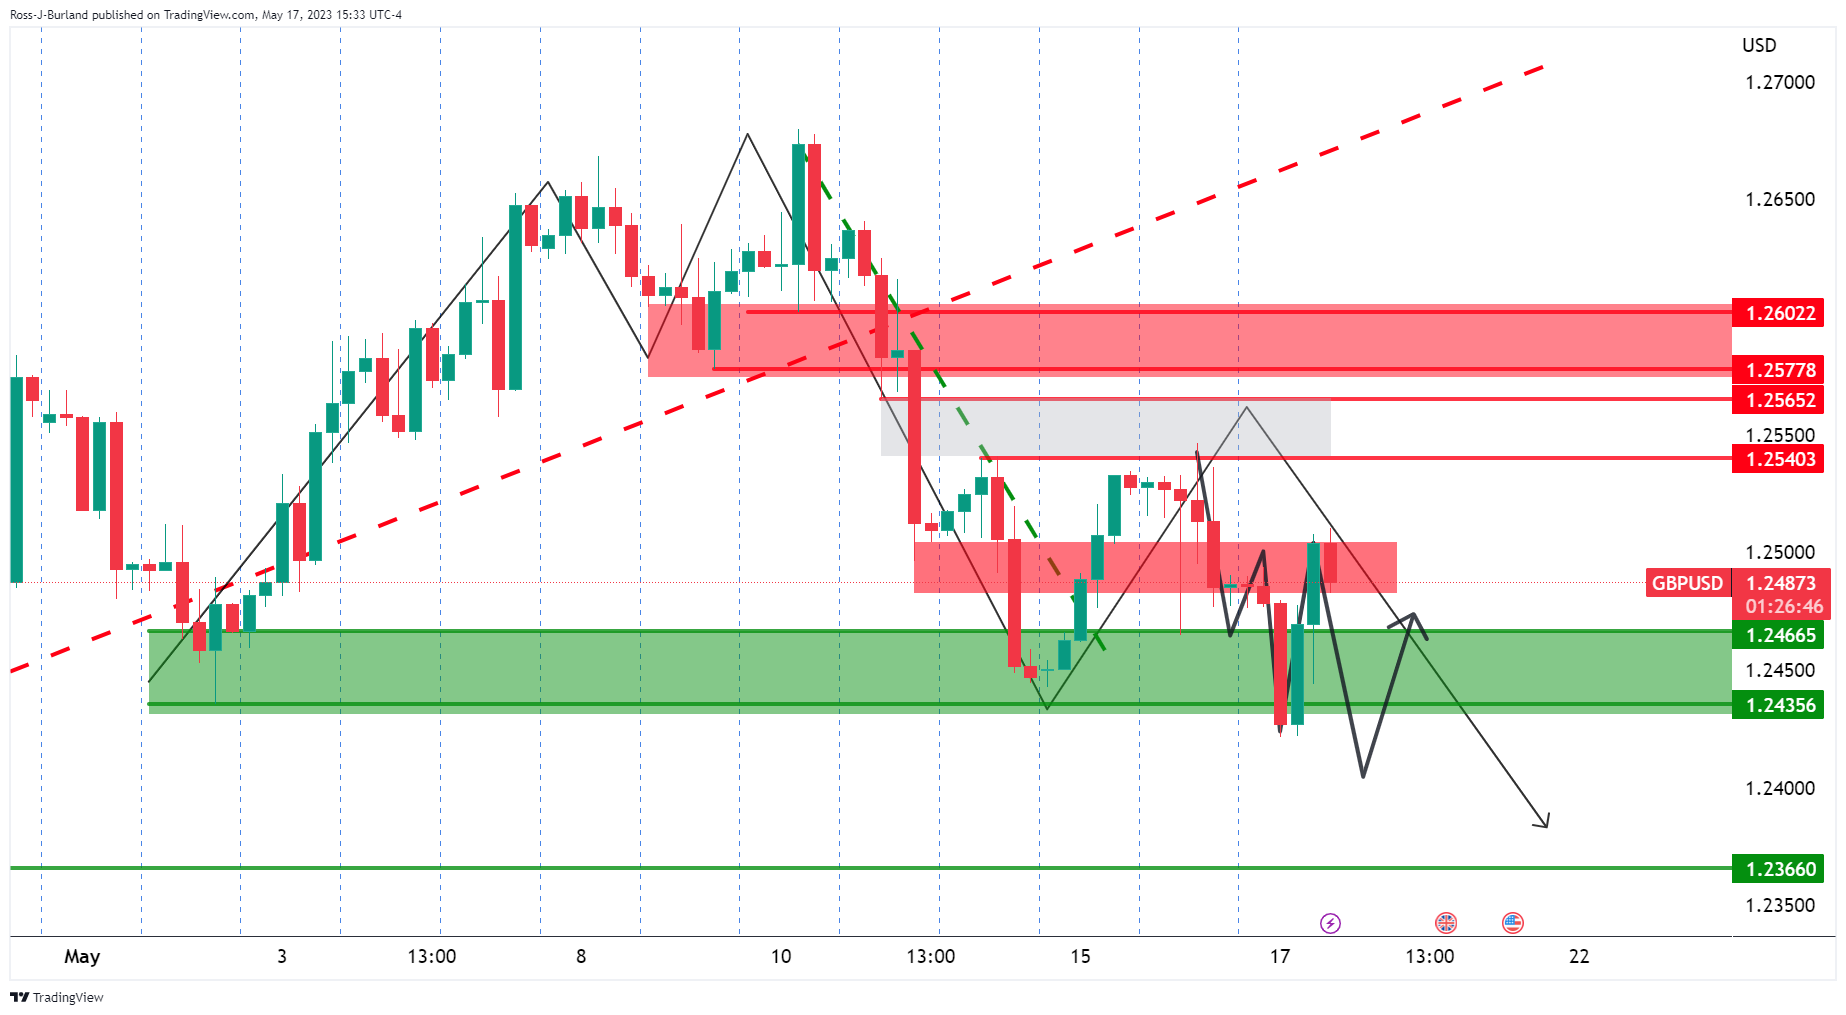
GBP/USD H4 chart

The price has shot up to test resistance and while there are prospects of an onward continuation, the price can easily head lower as illustrated in the chart above.