- USD/CAD Price Analysis: Bears are testing bullish commitments at trendline support
Market news
USD/CAD Price Analysis: Bears are testing bullish commitments at trendline support
- USD/CAD bulls are giving way to the bears.
- USD/CAD bears are breaking the trendline support.
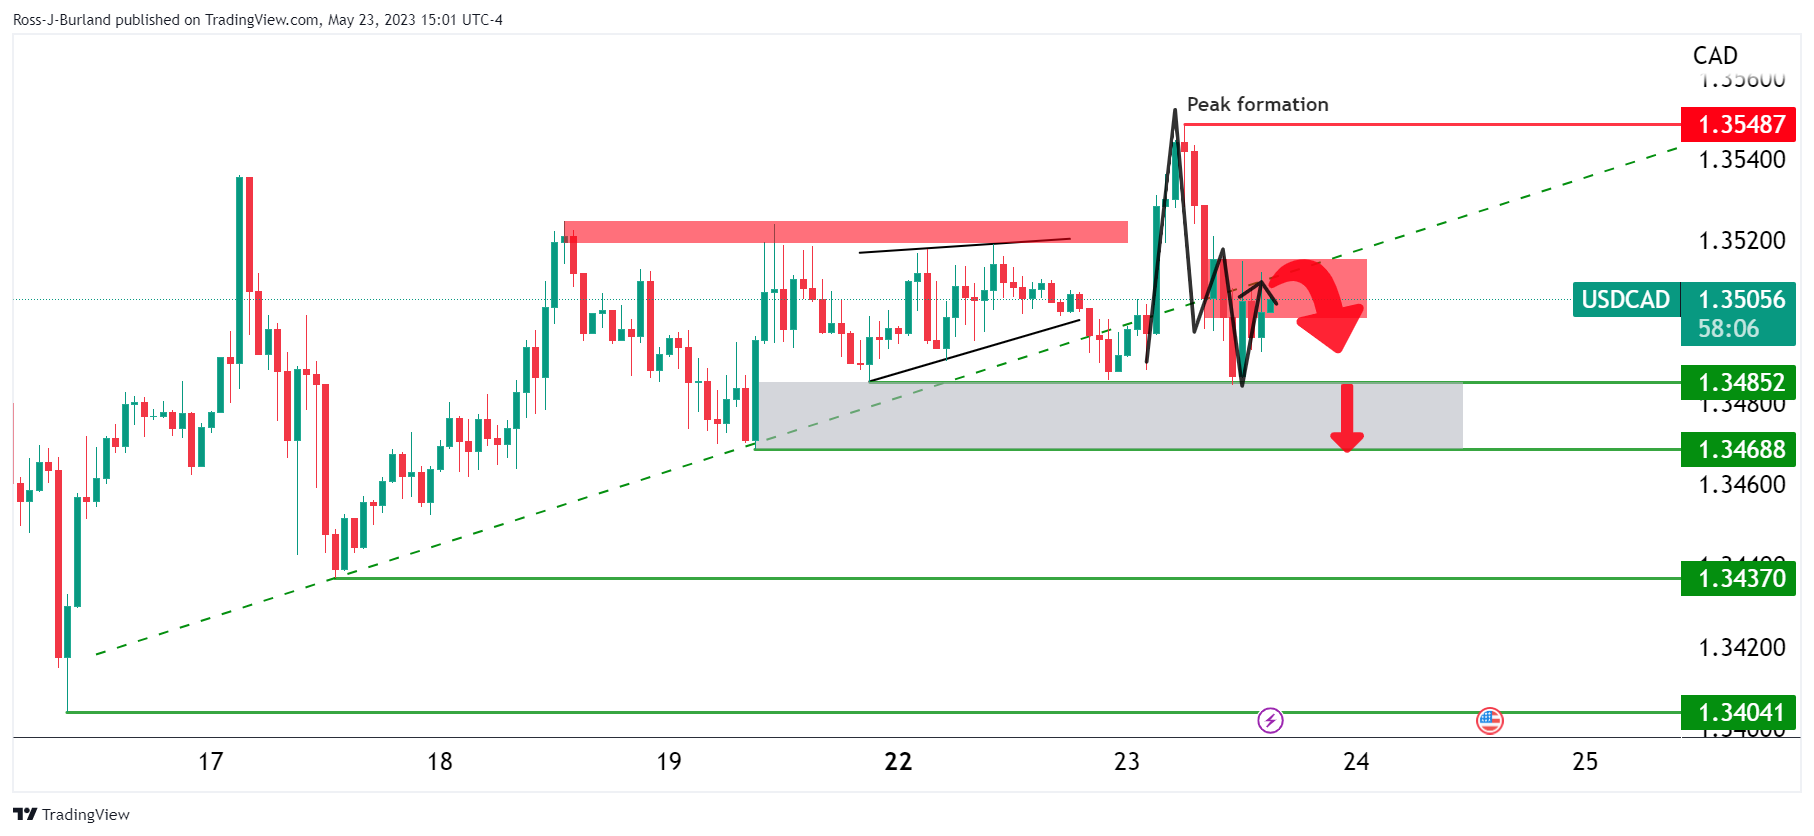
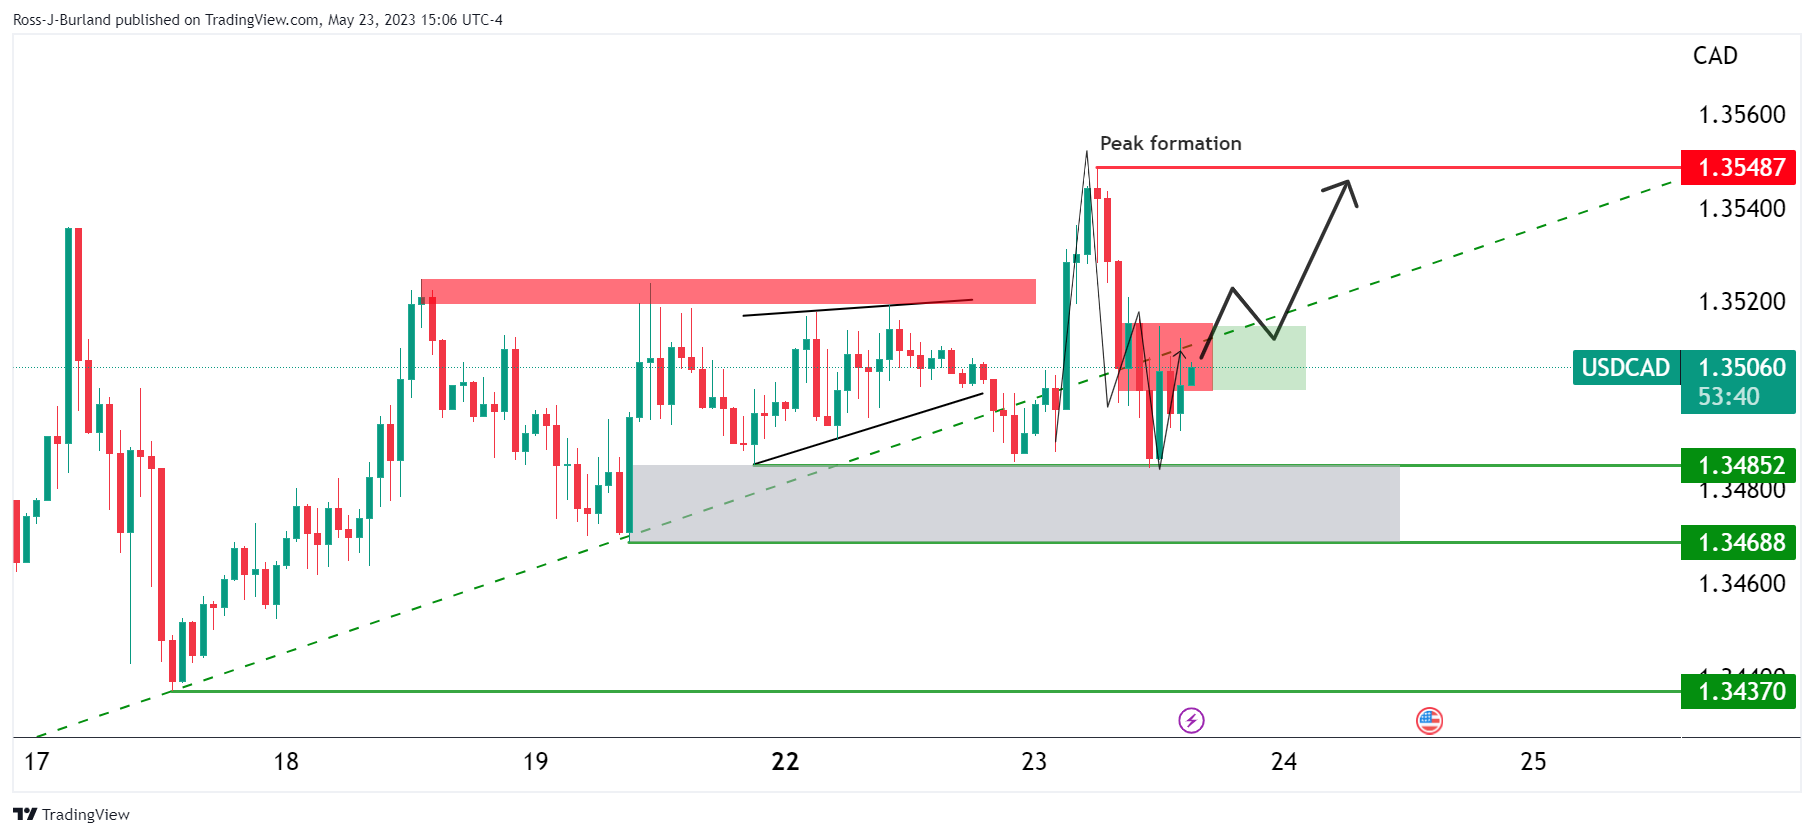
USD/CAD has ranged between a low of 1.3484 and a high of 1.3548 on the day. The bears are in the market and attempting to break down the bullish trend that has been building since the start of May. The following illustrates two scenarios, bullish and bearish, on the hourly chart.
USD/CAD H1 charts

The bullish scenario above sees the price testing counter-trendline resistance and the M-formation´s neckline. If the bears engage fully, then we could see the makings of a downside continuation into the 1.3470s.

A bullish scenario would see a break of the resistance and move into the shorts from the peak formation, moving back onto the front side of the bullish trendline.