- Silver Price Analysis: XAG/USD approaches oversold conditions
Market news
Silver Price Analysis: XAG/USD approaches oversold conditions
- Silver price is on a 4-day losing streak.
- Bears running out of steam near overbought RSI.
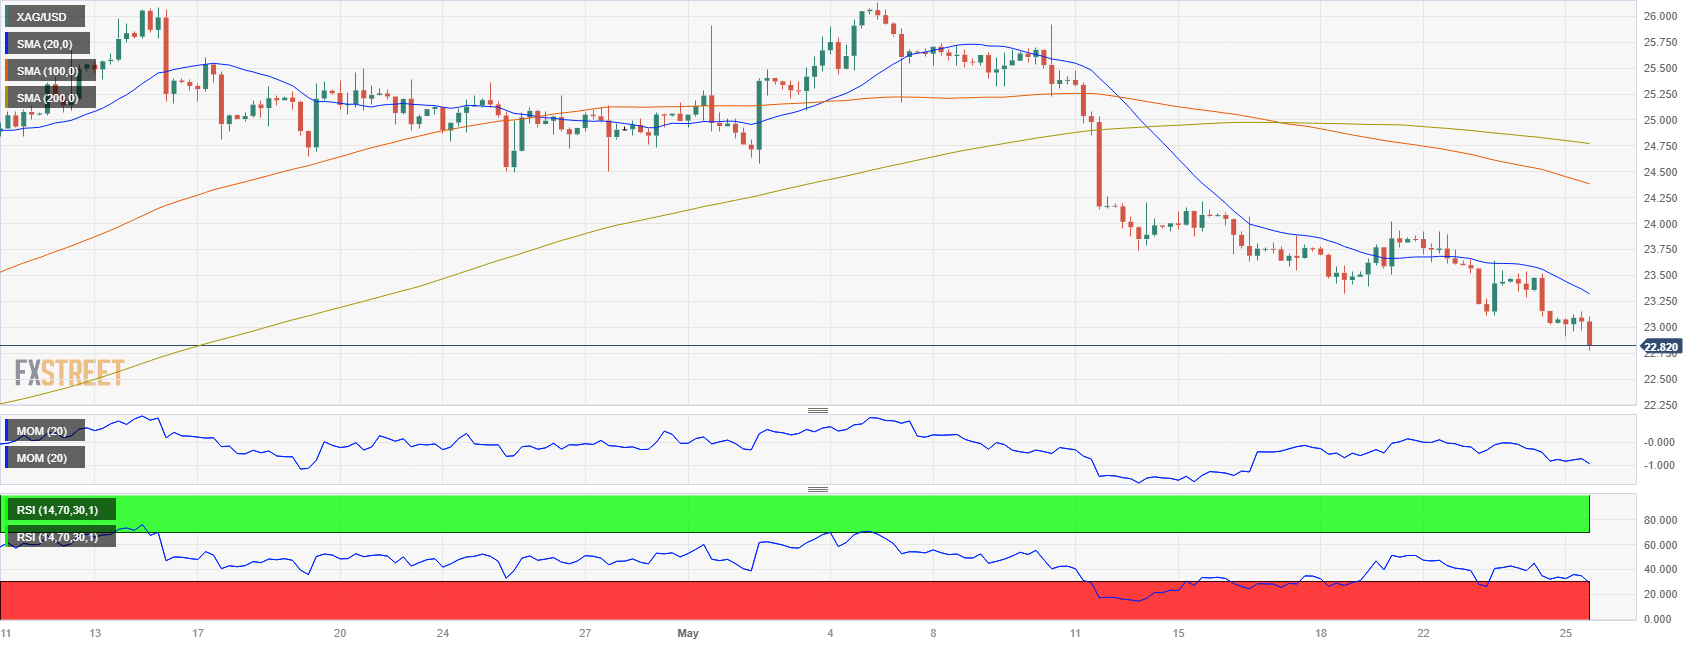
- 100 and 200-day SMAs could serve as support and resistance levels in sideways trading period.
Silver price (XAG/USD) trades with 0.57% losses at $22.93 at the time of writing, after bottoming at a low of $22.75 during the early Asian session. The precious metal price is trading in the red for a fourth consecutive day, and buyers should not ignore that technical indicator on the daily chart are approaching oversold conditions.
That being said, the Relative Strength Index (RSI) is just above the overbought threshold while the Moving Average Convergence Divergence (MACD) has been standing in negative territory since mid-April, suggesting that a technical correction may be on the horizon.
In addition, XAG/USD lost the 100-day Simple Moving Average (SMA) for the first time since March and now has its last support at the 200-day SMA at $22.01. So, considering the possibility of an upwards correction, the price can use the mentioned moving averages as support and resistances for consolidating the losses and then entering a period of sideways trading.