- GBP/JPY Price Analysis: Steadies its climb amid mixed sentiment and strong UK inflation data
Market news
GBP/JPY Price Analysis: Steadies its climb amid mixed sentiment and strong UK inflation data
- Tech stock advancement creates mixed investor sentiment, allowing GBP/JPY to sustain gains.
- GBP/JPY upward trend continues, eyeing potential reversal upon Bank of Japan's policy shifts.
- In case of a dip below 172.00, GBP/JPY could test the two-week low of 171.19 and further the 170.00 mark.
GBP/JPY edges high but fell shy of reaching a new year-to-date (YTD) high above 172.79 and remains in positive territory, albeit a mixed sentiment amongst investors, as tech stocks advance. Consequently, safe-haven peers like the Japanese Yen (JPY) retraced some of their earlier gains sustained in the Asian session. At the same time, inflation data from the United Kingdom (UK) justifies the need for further tightening, underpinning Sterling (GBP). At the time of writing, the GBP/JPY is trading at 172.46.
GBP/JPY Price Analysis: Technical outlook
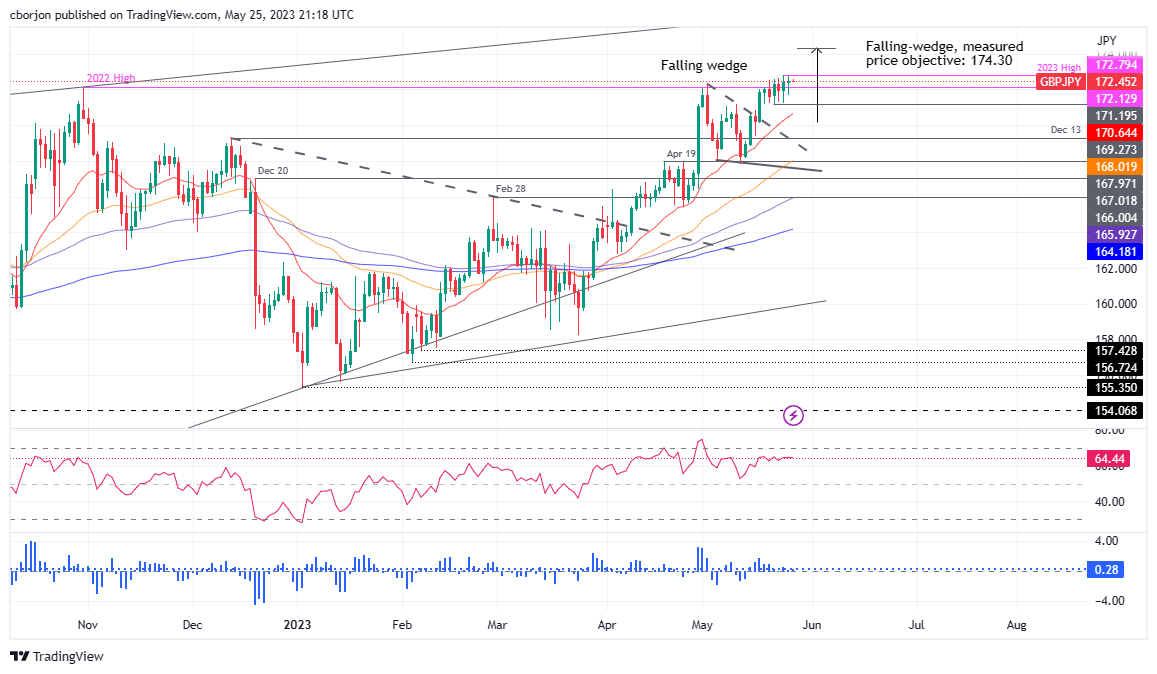
From a daily chart perspective, the GBP/JPY uptrend would continue before fundamental reasons change, like the Bank of Japan (BoJ) shifting its monetary policy, could open the door for a good reversal. Nevertheless, once the GBP/JPY falling wedge was broken to the upside, and Cable regained momentum above the May 2 high of 172.33, that opened the door for further gains. Since then, the GBP/JPY consolidated at 171.20-172.79 as buyers prepared to launch an assault and hit the falling-wedge measured target at 174.30.
Hence, the GBP/JPY path of least resistance is upwards. The first line of defense for GBP/JPY sellers would be the YTD high of 172.79, which is broken; the pair will move upwards and test 173.00. A breach of the latter will expose the 174.00 figure, ahead of the falling-wedge objective at 174.30.
On the flip side, if GBP/JPY slips below 172.00, that could pave the way to test the latest two-week low of 171.19 before testing the 170.00 mark. If GBP/JPY dives below that level, the 20-day Exponential Moving Average (EMA) could cap the downfall at around 170.65.
GBP/JPY Price Action – Daily chart