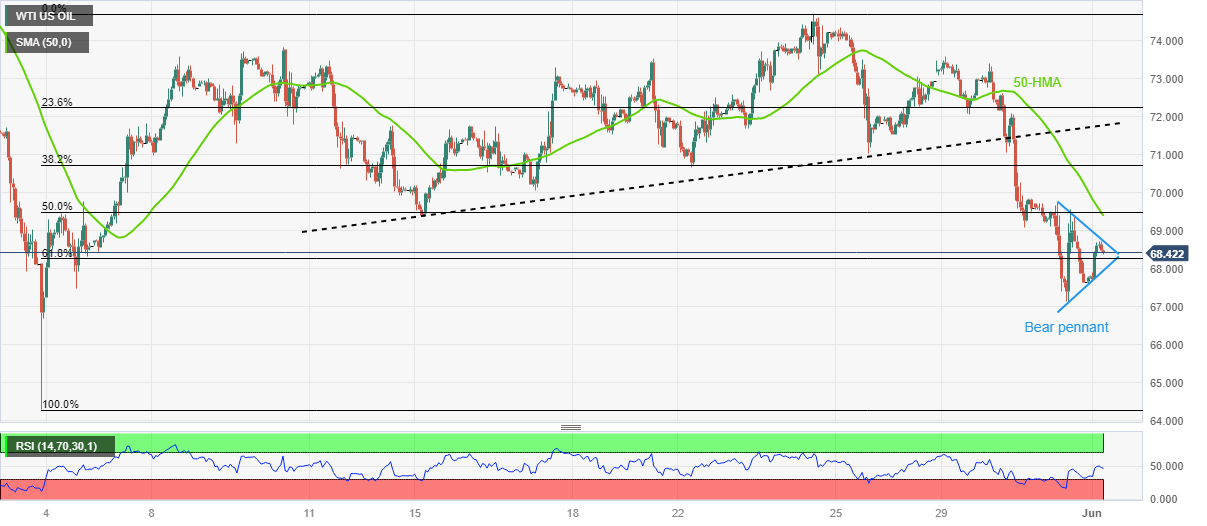
- WTI Price Analysis: Bear pennant challenges Oil buyers around mid-$68.00s
Market news
WTI Price Analysis: Bear pennant challenges Oil buyers around mid-$68.00s
- WTI clings to mild gains during the first positive day in three, fades upside momentum of late.
- Sustained break of previous key support, bearish chart formation keeps Oil bears hopeful.
- Clear break of $67.95 can trigger fresh downswing, bulls remain cautious below $74.70.
WTI crude oil consolidates the biggest weekly loss in three by printing minor upside near $68.50, making 1.10% intraday gains heading into Thursday’s European session. In doing so, the black gold snaps two-day downtrend but stays within an immediate bear pennant chart formation suggesting further declines of the energy benchmark.
It’s worth noting that the quote’s early-week break of an upward-sloping support line from May 15, now resistance near $71.75, joins the near 50.0 level of RSI (14) line to keep the sellers hopeful.
However, a clear downside break of the stated pennant’s bottom line, close to $67.95 by the press time, becomes necessary for the Oil sellers to retake control.
Following that, a slump towards the previous monthly low of around $64.30 can’t be ruled out. Though, $66.75 may act as an intermediate halt during the anticipated fall.
On the flip side, a clear break of the pennant’s top-line, near $68.80 at the latest, will defy the bearish chart formation and can propel the black gold towards a converngence of the 50-Hour Moving Average (HMA) and 50% Fibonacci retracement level of May’s upside, near $69.50.
In a case where the Oil price remains firmer past $69.50, the $70.00 round figure and the previous support line near $71.80 may act as extra checks for the bulls.
It should be observed that the energy buyers need to remain cautious unless witnessing a successful run-up beyond the previous monthly peak of around $74.70
WTI crude oil: Hourly chart

Trend: Further downside expected