- Silver Price Analysis: XAG/USD stalls the recent positive move near 38.2% Fibo. level
Market news
Silver Price Analysis: XAG/USD stalls the recent positive move near 38.2% Fibo. level
- Silver climbs to a two-week high on Friday, albeit struggles to capitalize on the move.
- Bulls now await a sustained move beyond the $24.00 mark before placing fresh bets.
- Weakness below the 100-day SMA is needed to negate the near-term positive outlook.
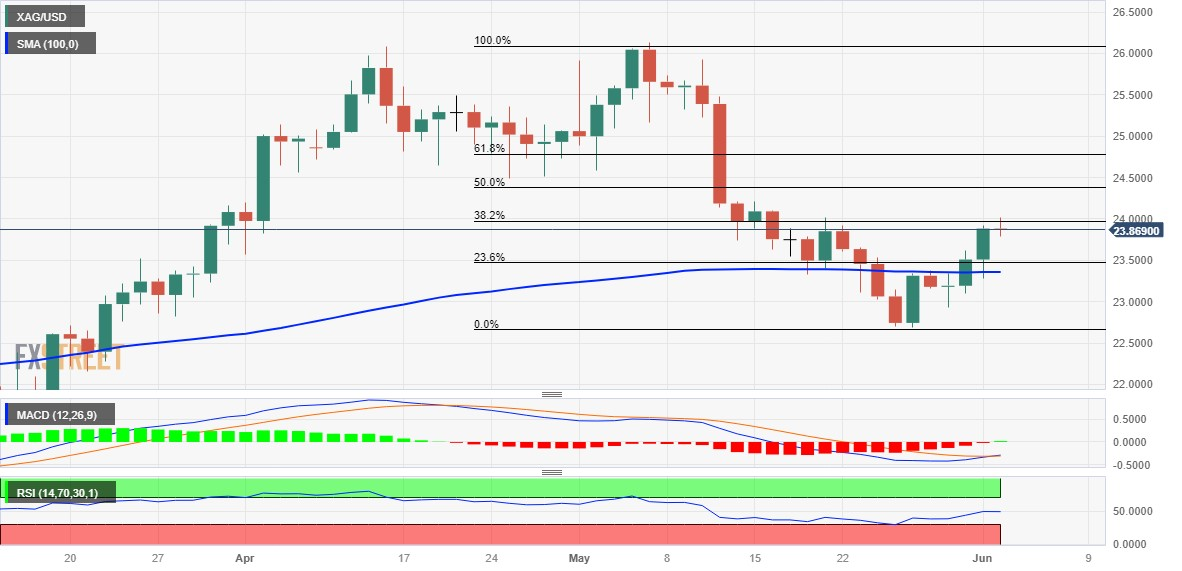
Silver builds on its recent goodish rebound from sub-$23.00 levels and climbs to a two-week high on Friday, albeit struggles to capitalize on the modest intraday uptick. The white metal pulls back from the vicinity of the $24.00 mark, representing the 38.2% Fibonacci retracement level of the downfall in May, and trades with a mild positive bias during the early European session.
From a technical perspective, this week's sustained move beyond the 100-day Simple Moving Average (SMA) and the overnight break through the 23.6% Fibo. level favours bullish traders. Moreover, oscillators on the daily chart have recovered from the negative territory, though are yet to confirm a positive outlook. This makes it prudent to wait for some follow-through buying beyond the $24.00 mark before positioning for an extension of the recent bounce from over a two-month low touched last week.
The XAG/USD might then accelerate the momentum towards the next relevant hurdle near the $24.20-$24.25 region en route to the $24.40-$24.50 horizontal support breakpoint. The latter coincides with the 50% Fibo. level, above which a fresh bout of a short-covering should allow bullish traders to reclaim the $25.00 psychological mark. The upward trajectory could get extended towards the $25.30-$25.35 supply zone before the commodity eventually makes a fresh attempt to conquer the $26.00 mark.
On the flip side, any meaningful pullback now seems to attract fresh buyers near the mid-$23.00s, or the 23.6% Fibo. level. This should help limit the downside for the XAG/USD near the 100-day SMA, currently pegged around the $23..35 area. That said, a convincing break below will expose the $23.00 mark. This is followed by the May monthly swing low, around the $22.70-$22.65 region, which if broken decisively will negate any positive outlook and shift the bias back in favour of bearish traders.
Silver daily chart
Key levels to watch