- Gold Price Forecast: XAU/USD fits above $1960 as USD looks fragile, US CPI hogs limelight
Market news
Gold Price Forecast: XAU/USD fits above $1960 as USD looks fragile, US CPI hogs limelight
- Gold price has got acceptance above $1,960.00 ahead of the US inflation data.
- The energy component is expected to keep significant pressure on US inflation.
- A clash of US CPI data and a volatile contraction pattern by the Gold price is going to deliver an explosion.
Gold price (XAU/USD) has shifted its auction above the crucial resistance of $1,960.00 ahead of the release of the United States Consumer Price Index (CPI) data, which will release at 12:30 GMT. The precious metal is expected to show volatile moves as investors are keenly awaiting the US inflation numbers to deduce cues about Federal Reserve’s (Fed) interest rate policy.
S&P500 futures are holding gains added from the Asian session as the odds of a neutral interest rate decision by the Fed are extremely solid. Market sentiment is quite upbeat and the appeal of risk-sensitive assets is stronger.
The US Dollar Index (DXY) is looking vulnerable near its two-week low of around 103.20 as the market participants are anticipating that the energy component will keep significant pressure on the US inflation.
Analysts at NBF expect the energy component may have had a negative impact on the headline index as prices likely fell in both the gasoline and natural gas segments. Expected gains for shelter could still result in a 0.2% monthly increase in headline prices. If we’re right, the annual rate should come down from 4.9% to a two-year low of 4.1%. The core index, meanwhile, could have advanced 0.3% on a monthly basis, something which would translate into a 5.1% annual gain.
The pressure of higher chances for a neutral Fed policy is visible on US Treasury yields. The return delivered on 10-year US Treasury bonds has dropped to near 3.72%.
Gold technical analysis
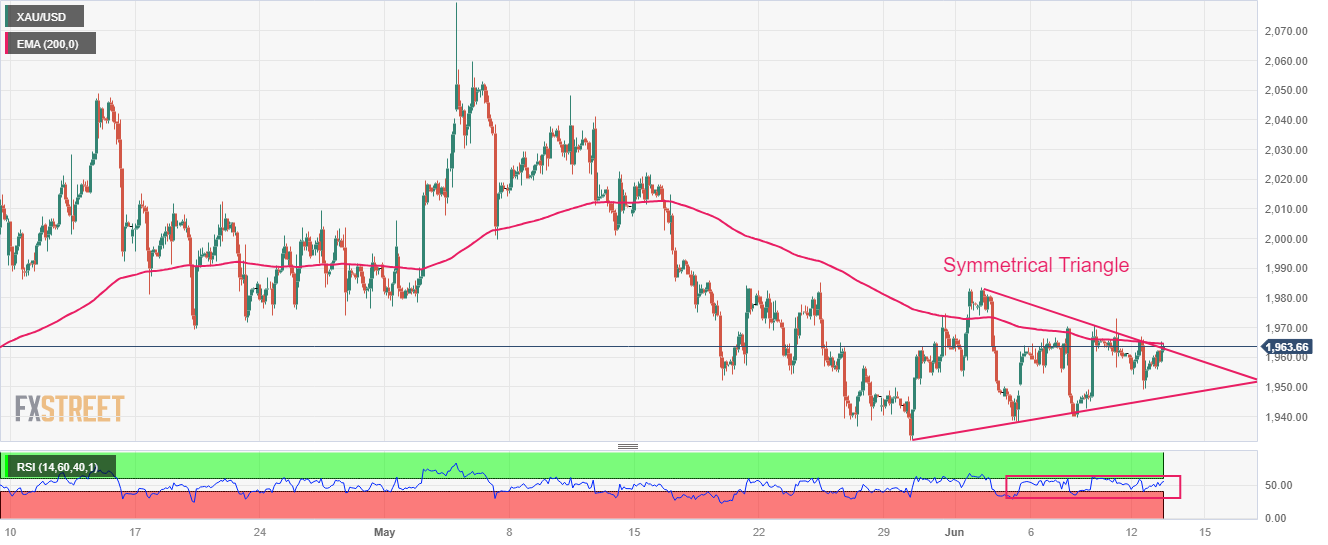
Investors should be prepared for a sheer volatile action by the Gold price ahead of the US inflation data. Gold price has been forming a Symmetrical Triangle chart pattern on a two-hour scale and a clash of first-tier US economic data and a volatile contraction pattern is going to deliver an explosion, which will be followed by wider ticks and heavy volume.
The 50-period Exponential Moving Average (EMA) at $1,964.48 is sticky with the Gold price, portraying non-directional movements.
Adding to that, the Relative Strength Index (RSI) (14) is oscillating in the 40.00-60.00 range, which indicates that investors await crucial data.
Gold price two-hour chart