- Gold Price Forecast: XAU/USD recovery roadblock at $1,960, Fed eyed – Confluence Detector
Market news
Gold Price Forecast: XAU/USD recovery roadblock at $1,960, Fed eyed – Confluence Detector
- Gold Price consolidates weekly loss ahead of Federal Reserve Interest Rate Decision.
- Market players put 95% bets on Fed’s status quo even as dot-plot, Powell’s speech can surprise XAU/USD bulls.
- Cautious optimism, softer US Dollar keeps the Gold Price firmer but multiple checks prod XAU/USD upside.
Gold Price (XAU/USD) clings to mild gains as it snaps a three-day downtrend, as well as consolidation the weekly loss, while positioning for the Federal Open Market Committee (FOMC) monetary policy meeting announcements. That said, the pre-Fed anxiety and the US-China tussles joined firmer Treasury bond yields to previously weigh on the XAU/USD. However, downbeat prints of the US inflation numbers, as per the Consumer Price Index (CPI) and Core CPI figures for May, drowned the US Dollar and recall the Gold buyers.
While the US inflation has already challenged the Fed’s 18-month-old rate hike cycle, the US central bank isn’t expected to turn dovish. The same highlights details of the economic forecasts, dot-plot and Chairman Jerome Powell’s press conference for clear directions. Should the Fed policymakers suggest a July rate hike and many more, the Gold Price may slip off the bull’s radar while dovish remarks won’t hesitate to propel the XAU/USD past the $1,960 hurdle.
Also read: Gold Price Forecast: XAU/USD tested 100 DMA on US CPI, what’s next on Federal Reserve decision?
Gold Price: Key levels to watch
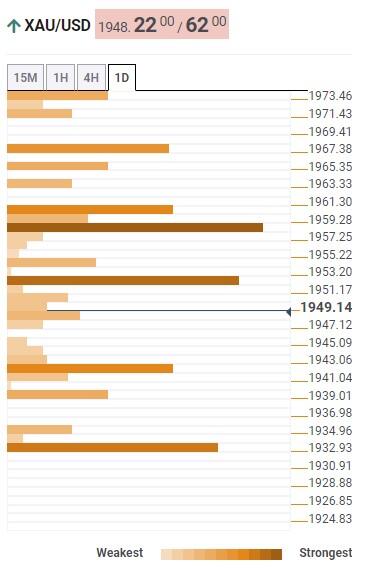
As per our Technical Confluence Indicator, the Gold Price edges higher past the $1,932 support comprising the previous monthly low, Pivot Point one-day S1 and the lower band of the Bollinger on the hourly chart.
Also keeping the XAU/USD bulls hopeful is the quote’s sustained trading past the $1,943 previous upside hurdle, including the 100-DMA, Pivot Point one-week S1and the previous low on the four-hour (4H) chart.
However, a convergence of the Fibonacci 61.8% on one-week and 38.2% in one-day prods immediate upside of the Gold Price near $1,953.
Following that, 10-DMA, 100-SMA on 4H and the Fibonacci 61.8% on one-day together highlight the $1,958 as a tough nut to crack for the Gold buyers.
Also acting as an upside filter is the $1,960 round figure encompassing the middle band of the Bollinger on the daily chart and the Fibonacci 38.2% on one-week.
It should be noted that the $1,970 mark including the Fibonacci 38.2% on one-month joins the upper band of the Bollinger on the hourly chart to act as the final defense of the Gold bears.
Here is how it looks on the tool
About Technical Confluences Detector
The TCD (Technical Confluences Detector) is a tool to locate and point out those price levels where there is a congestion of indicators, moving averages, Fibonacci levels, Pivot Points, etc. If you are a short-term trader, you will find entry points for counter-trend strategies and hunt a few points at a time. If you are a medium-to-long-term trader, this tool will allow you to know in advance the price levels where a medium-to-long-term trend may stop and rest, where to unwind positions, or where to increase your position size.