- US Dollar Index Price Analysis: DXY bounces off 50% Fibonacci retracement, 103.85-90 region, US data in focus
Market news
US Dollar Index Price Analysis: DXY bounces off 50% Fibonacci retracement, 103.85-90 region, US data in focus
- US Dollar Index grinds near intraday high as it recovers from the lowest level in a month.
- Oversold RSI, key Fibonacci retracement recall DXY buyers.
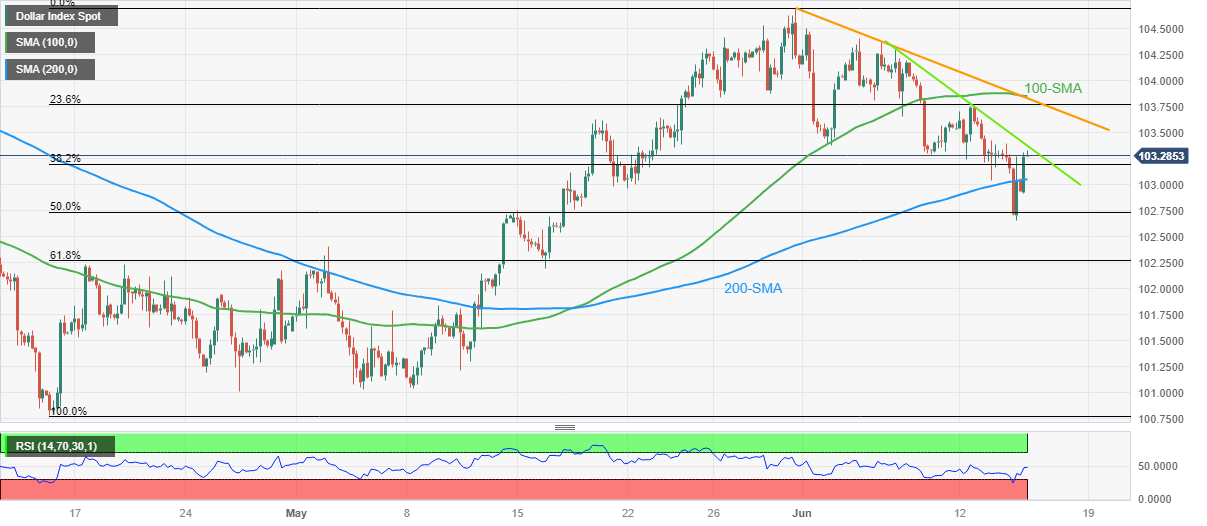
- Convergence of 100-SMA, fortnight-old descending trend line appears a tough nut to crack for greenback bulls.
US Dollar Index (DXY) seesaws around the daily top near 103.30 heading into Thursday’s European session. In doing so, the greenback’s gauge versus the six major currencies prints the first daily gain in three while bouncing off the monthly low.
It’s worth noting that the DXY dropped to the lowest levels in a month the previous day after the US Federal Open Market Committee (FOMC) kept the benchmark interest rate unchanged at 5.0-5.25%, matching market expectations. However, the upbeat FOMC Economic Projections and Federal Reserve (Fed) Chairman Jerome Powell’s speech renewed the hawkish Fed bias and triggered the US Dollar’s rebound afterward.
On a different page, failure on the part of the US Dollar Index to stay beneath the 50% Fibonacci retracement level of April-May upside, near 102.75 by the press time, joined the nearly oversold RSI (14) line to favor the DXY bulls of late. Adding strength to the recovery expectations is the quote’s sustained trading beyond the 200-SMA, following a brief fall post-Fed.
However, a downward-sloping resistance line from June 06, close to 103.40 at the latest, guards the immediate upside of the US Dollar Index.
Following that, a convergence of the 100-SMA and a fortnight-old resistance line, surrounding 103.85-90, appears a tough nut to crack for the US Dollar Index buyers.
Meanwhile, DXY sellers need validation from the 200-SMA and the aforementioned Fibonacci retracement level, respectively near 103.00 and 102.75, to retake control.
Even so, the 61.8% Fibonacci retracement, also known as the “Golden Fibonacci ratio”, can challenge the US Dollar Index bears around 102.30.
US Dollar Index: Four-hour chart
Trend: Limited recovery expected