- GBP/JPY Price Analysis: Bears making a move and eye key trendline support
Market news
GBP/JPY Price Analysis: Bears making a move and eye key trendline support
- GBP/JPY bears are moving into for the kill sensing tiring bulls.
- The bears eye the trendline support as first port of call.
GBP/JPY bulls are in the market but there are prospects of a significant correction brewing. The following will illustrate the price across a monthly, daily and 4-hour time frame to offer a top-down analysis arriving at a near-term bearish bias.
GBP/JPY monthly chart

The monthly charts show that the price has been rising for six consecutive months and is running into a potential resistance area.
GBP/JPY daily chart
Therefore, a correction could be on the way and the daily chart shows that the price is decelerating. This might lead to the bulls throwing in the towel as we approach key domestic events on the calendar.
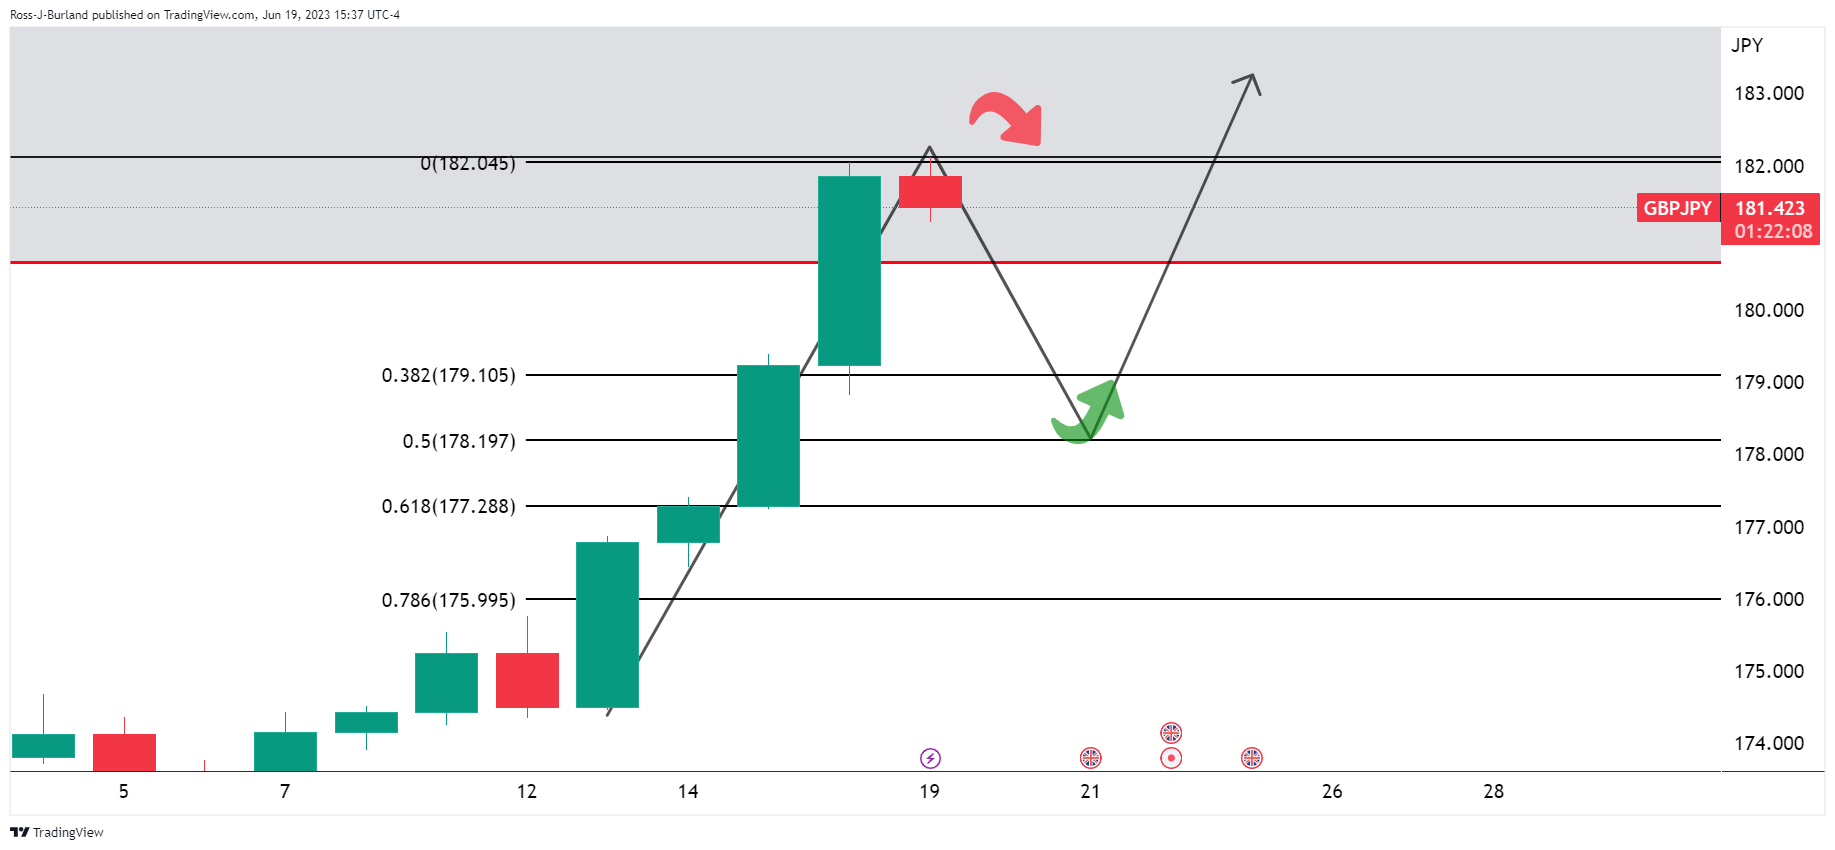
GBP/JPY H4 chart

From a 4-hour perspective, the bullish trendline is still intact but the bears are heading in for the kill. A bearish correction to the 38.2% Fibonacci will be testing the trendline support.