- Silver Price Analysis: XAG/USD hangs near three-month low, bears flirt with 200-day SMA
Market news
Silver Price Analysis: XAG/USD hangs near three-month low, bears flirt with 200-day SMA
- Silver remains depressed for the fourth straight day and languishes near a three-month low.
- The setup favours bearish traders and supports prospects for a breakthrough the 200-DMA.
- Any attempted recovery could attract fresh sellers near the $23.00 mark and remains capped.
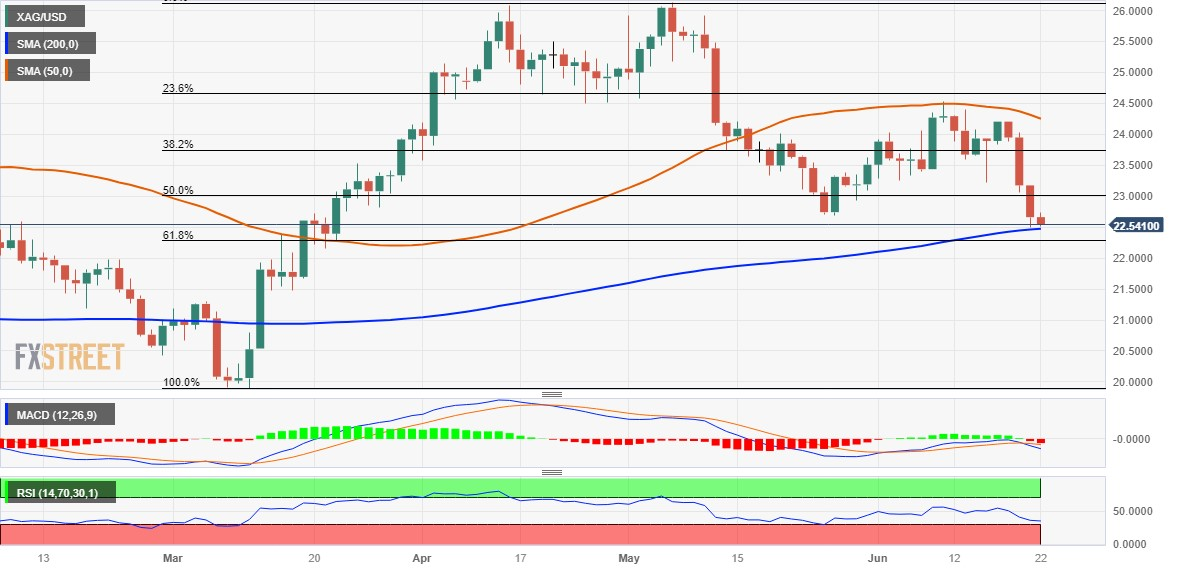
Silver enters a bearish consolidation phase on Thursday and oscillates in a narrow trading band around the $22.50-$22.60 area or a three-month low touched the previous day. The white metal, however, manages to hold its neck just above the very important 200-day Simple Moving Average (SMA) support, which should act as a key pivotal point for short-term traders.
Against the backdrop of the recent failure near the 50-day SMA, bearish oscillators on the daily chart support prospects for an eventual breakdown through the technically significant moving average. Some follow-through selling below the $22.25 area, representing the 61.8% Fibonacci retracement level of the March-May rally, will be seen as a fresh trigger for bearish traders and pave the way for further losses.
The XAG/USD might then turn vulnerable to weaken further below the $22.00 mark and accelerate the downfall towards testing the $21.70-$21.65 support zone. The downward trajectory could get extended towards the $21.25 intermediate support en route to the $21.00 round figure and the next relevant support near the $20.50 area. Bears might eventually target the YTD low, levels just below the $20.00 psychological mark.
On the flip side, any meaningful recovery attempt might now confront stiff resistance near the $23.00 mark, which coincides with the 50% Fibo. level. That said, a sustained strength beyond could trigger a short-covering rally and lift the XAG/USD to the $23.30-$23.35 intermediate hurdle en route to 38.2% Fibo. level, around the $23.70-$23.75 zone. The latter should act as a key barrier and cap any further gains.
Silver daily chart
Key levels to watch