- US Dollar Index (DXY): Surges on upbeat US data, buyers eye the 200-day EMA
Market news
US Dollar Index (DXY): Surges on upbeat US data, buyers eye the 200-day EMA
- The US Dollar Index sees a 0.37% climb, driven by higher US Treasury bond yields and prospects of Fed tightening.
- DXY’s consolidation shows EMAs below current prices, while RSI crosses neutral line, indicating bullish momentum.
- DXY targets resistance at 200-day EMA at 103.631, followed by 104.000, with the potential to rally towards May 31 high.
The US Dollar Index (DXY), which measures the performance of the US Dollar (USD) against a basket of six currencies, climbed 0.37% on Thursday, underpinned by higher US Treasury bond yields after US economic data justified additional tightening by the US Federal Reserve (Fed). Therefore, the DXY is trading at 103.351 after hitting a two-week high of 103.437.US
US Dollar Index Price Analysis: Technical outlook
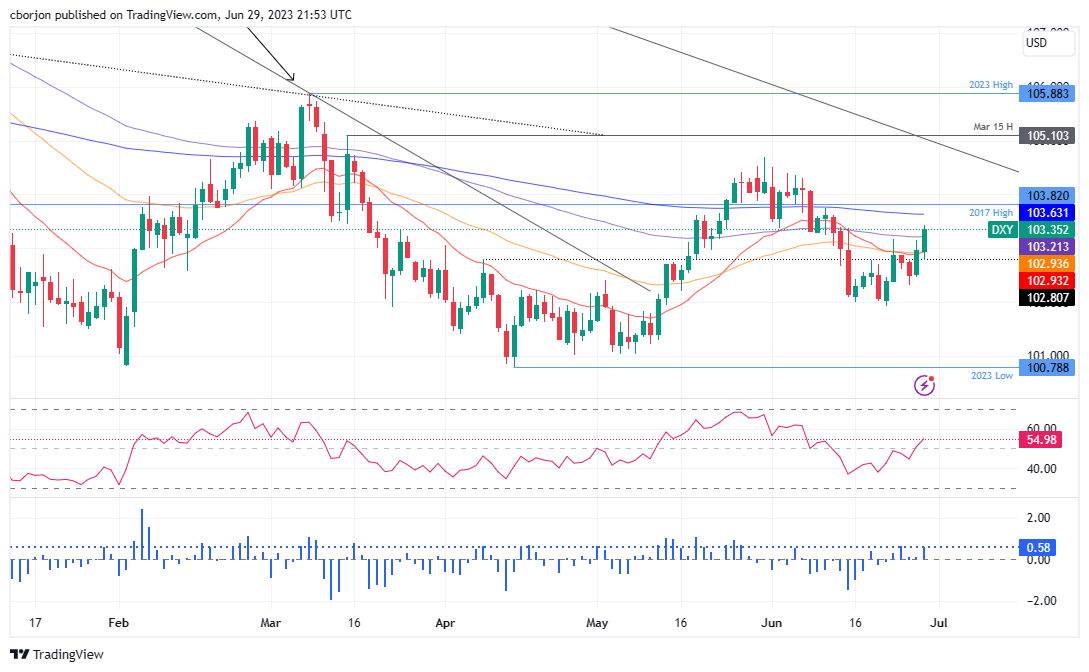
From a daily chart perspective, the DXY consolidates with shorter time-frame Exponential Moving Averages (EMAs) below DXY’s prices, while the 200-day EMA sits slightly above the DXY’s current value at 103.631. In addition, failure to crack the year-to-date (YTD) low of 100.788 opened the door for a recovery, which was capped at around the May 31 high of 104.699.
If the DXY surpasses the 200-day EMA at 103.631, the 104.000 figure will emerge as the next resistance level. Once broken, the DXY could rally toward the abovementioned May 31 high before the greenback tests a downslope resistance trendline drawn from the last year’s high that passes around 104.700/850. Once cleared, the next resistance would be the year-to-date (YTD) high of 105.883 before the DXY climbs toward the 106.000 mark.
Oscillators-wise, the Relative Strength Index (RSI) just crossed above the neutral line spurring a bullish signal, while the three-day Rate of Change (RoC) shows that buyers are gathering momentum.
US Dollar Index Price Action – Daily chart