- USD/INR Price Analysis: Bulls retain control near multi-week top, might aim to conquer 83.00
Market news
USD/INR Price Analysis: Bulls retain control near multi-week top, might aim to conquer 83.00
- USD/INR scales higher for the third straight day and climbs to a multi-week high on Thursday.
- The overnight sustained breakout through the 82.25 confluence hurdle favours bullish traders.
- Acceptance back below the 82.00 mark is needed to negate the near-term positive outlook.
The USD/INR pair attracts some buying for the third successive day on Thursday and climbs to over a three-week high during the Asian session. Spot prices currently trade just below mid-82.00s, up less than 0.10% for the day, and seem poised to build on the recent strong recovery from the 81.75 region, or the lowest level since May 8 touched on Monday.
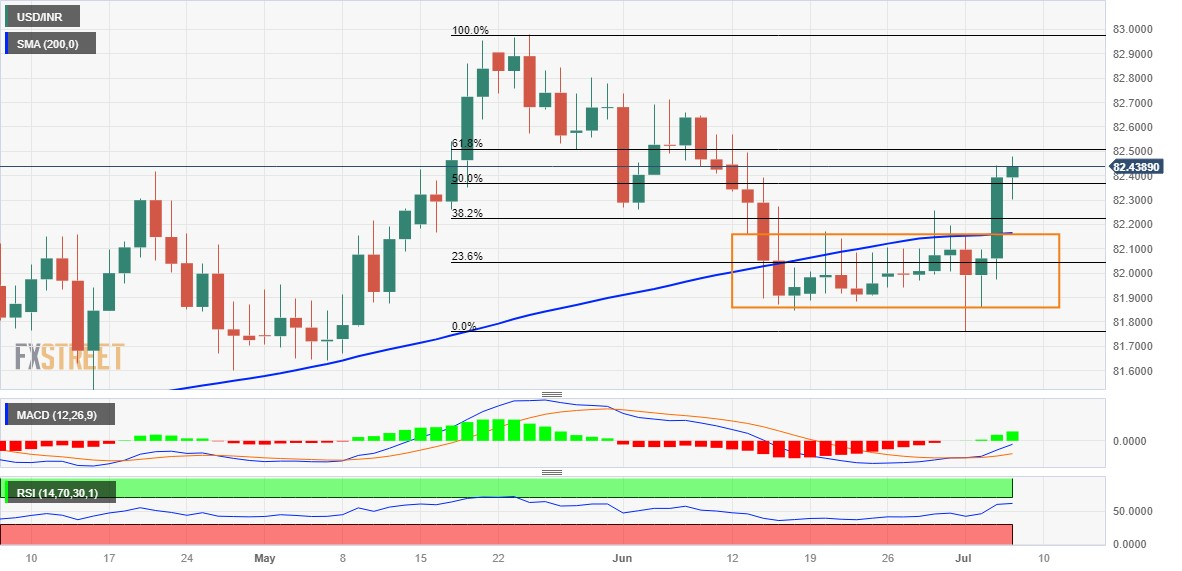
The overnight sustained strength beyond the top end of a multi-week-old trading range, which coincided with a technically significant 200-day Simple Moving Average (SMA), was seen as a fresh trigger for bullish traders. Moreover, oscillators on the daily chart have been gaining positive traction and are still far from being in the overbought zone. This, in turn, validates the positive outlook for the USD/INR pair.
From current levels, the 82.70-82.75 region is likely to act as an immediate resistance, above which spot prices could make a fresh attempt to conquer the 83.00 round figure. The said handle has been acting as a strong barrier since October 2022. Hence, some follow-through buying will mark a fresh bullish breakout and pave the way for a further near-term appreciating move for the USD/INR pair.
On the flip side, the 200-day SMA, around the 82.25 region, now seems to protect the immediate downside ahead of the 82.00 mark. This is followed by the monthly low, around the 81.75 zone, which if broken decisively will shift the bias in favour of bearish traders. The USD/INR pair might then accelerate the slide towards the 81.50 support before dropping to test sub-81.00 levels or the YTD low touched in January.
USD/INR daily chart
Key levels to watch