- USD/JPY Price Analysis: Subdued around 141.00 amidst technical indicators turning bearish
Market news
USD/JPY Price Analysis: Subdued around 141.00 amidst technical indicators turning bearish
- USD/JPY attempted to shift to a bearish outlook over the last couple of days, with three technical indicators suggesting a potential downside.
- The daily chart shows the pair trading above the Kijun-Sen at 141.43, indicating the potential for further upward movement past 141.95.
- Conversely, if prices remain below 142.00, the first level of support will be the Kijun-Sen at 141.15. If this level is breached, the 141.00 psychological would be exposed.
USD/JPY trades flat as the Asian session begins, exchanging hands at around 141.40s, following a choppy trading session, which formed a dragonfly doji. Hence, during the last couple of days, price action has tried to shift the USD/JPY pair bearish, with three technical indicators paving the way for further downside. At the time of writing, the USD/JPY is trading at 141.42.
USD/JPY Price Analysis: Technical outlook
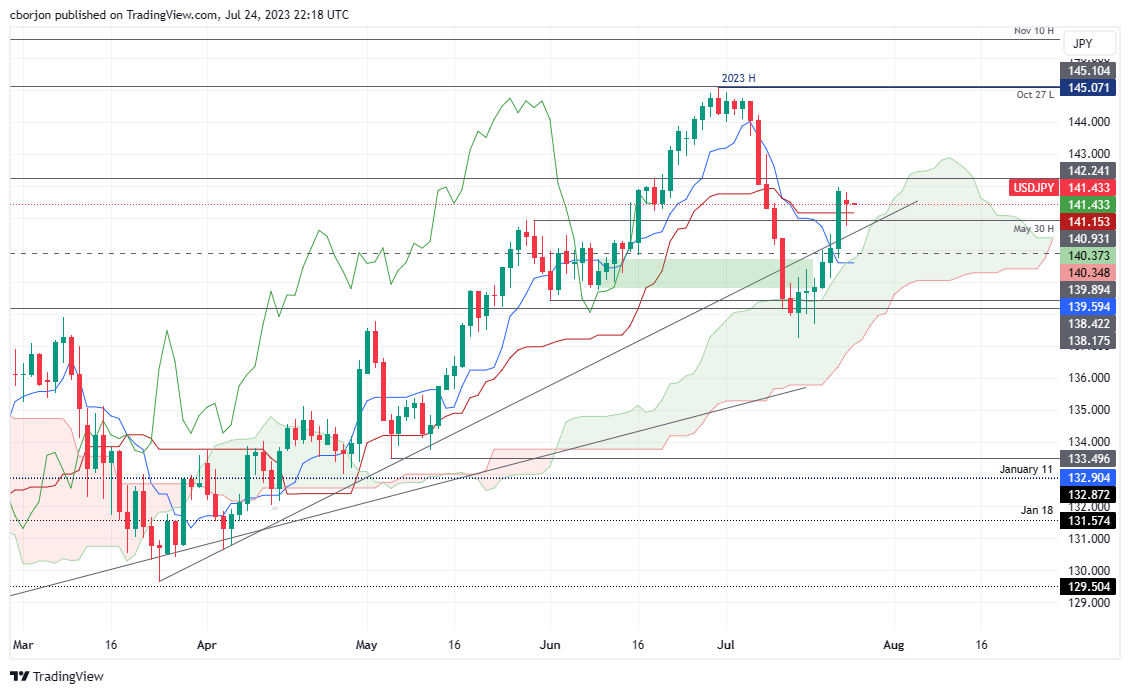
The daily chart portrays the pair trading above the Kijun-Sen at 141.43, which could pave the way for further upside, but buyers must reclaim the latest two-week high of 141.95. if USD/JPY breaks above 142.00, the next resistance will emerge at the top of the Ichimoku Cloud (Kumo) at around 142.80/95, ahead of challenging 143.00.
On the flip side, and the USD/JPY path of least resistance if prices stay below 142.00, the first support would be the Kijun-Sen at 141.15. A breach of that level will immediately expose the 141.00 psychological level, followed by a 5-month-old support trendline at around 140.50, before the majors test the next floor at the Tenkan-Sen line at 139.59.
USD/JPY Price Action – Daily chart