- Silver Price Analysis: XAG/USD flat-lines around $24.25-30 area, 100-day SMA holds the key
Market news
Silver Price Analysis: XAG/USD flat-lines around $24.25-30 area, 100-day SMA holds the key
- Silver struggles to preserve modest intraday gains, though holds above the weekly low.
- The technical setup warrants some caution before positioning for any meaningful slide.
- A break below the $24.00 mark, or the 100-day SMA, is needed to confirm a breakdown.
Silver attracts fresh selling following an intraday uptick to the $24.45 region on Wednesday and touches a fresh daily trough during the early European session on Wednesday. The white metal currently trades around the $24.30-$24.25 region, nearly unchanged for the day, and manages to hold its neck above the weekly low touched on Tuesday.
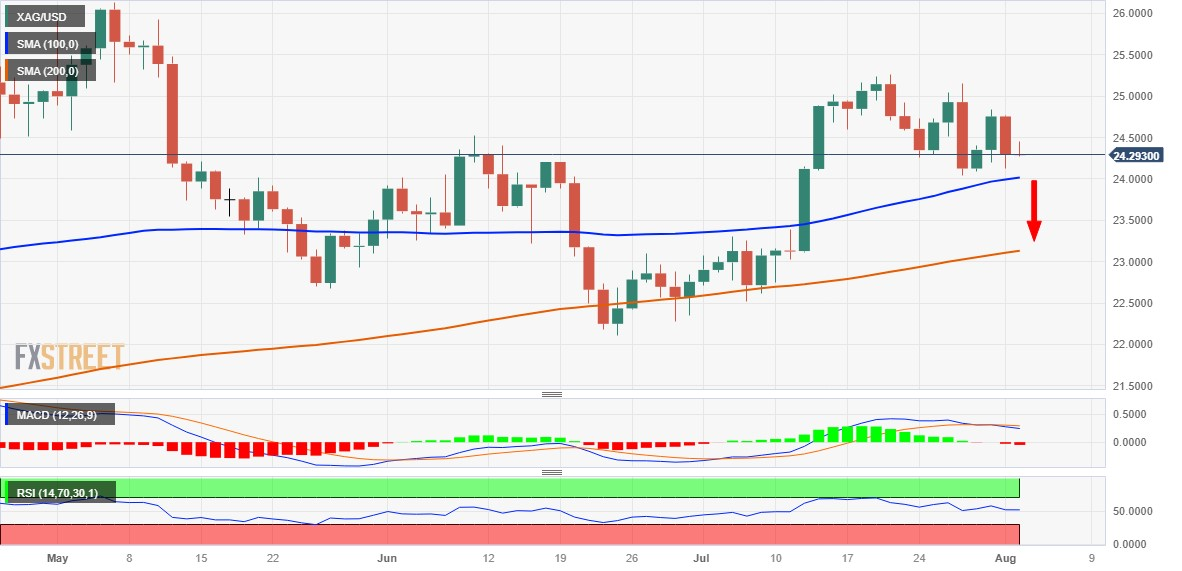
Any subsequent fall is more likely to find support near last week's swing low, around the $24.00 mark, which now coincides with a technically significant 100-day Simple Moving Average (SMA) and should act as a pivotal point. Meanwhile, oscillators on the daily chart - though have been losing traction - are yet to confirm a bearish outlook. This makes it prudent to wait for a sustained break below the said handle before positioning for any further depreciating move.
The XAG/USD might then accelerate the downward trajectory towards challenging the very important 200-day SMA, currently around the $23.15-$23.20 region. This is closely followed by the $23.00 round-figure mark, which if broken will expose the multi-month low, around the $22.15-$22.10 area touched in June.
On the flip side, the daily peak, around the $24.45 area, now seems to act as an immediate hurdle ahead of the $24.75 region, or the overnight swing high, and the $25.00 psychological mark. The next relevant hurdle is pegged near the monthly peak, around the $25.25 zone, which if cleared could lift the XAG/USD beyond the $25.50-$25.55 hurdle. Bulls might then aim to reclaim the $26.00 mark and retest the YTD peak, around the $26.10-$26.15 area touched in May.
Silver daily chart
Key levels to watch